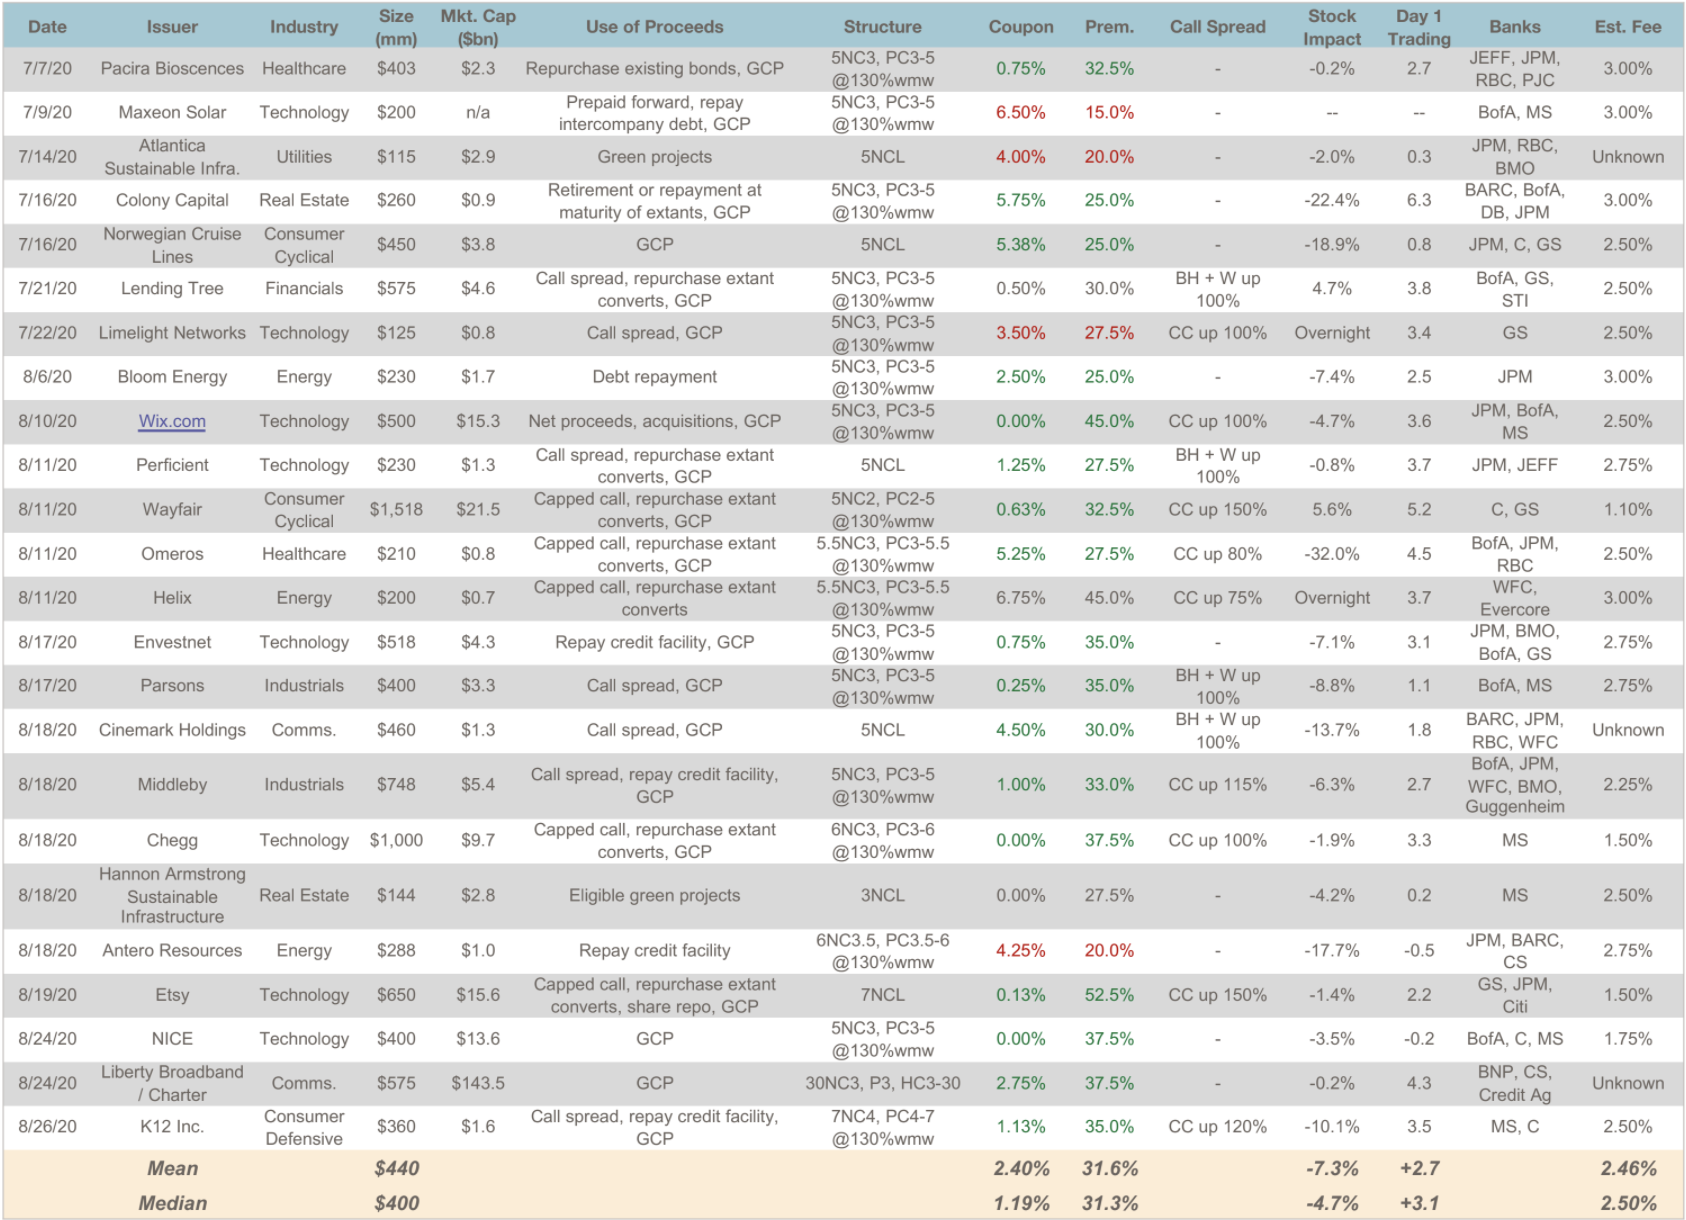
As part of our market update series, please see the summary below of what we saw in the convertible market in July and August 2020. Additional details on all the deals are in the attached.

- New Issuance. After a blistering $14 billion of convertible debt issued in June, July was more typically slow as most companies were in blackout, with $2.1 billion issued in 7 deals. August picked up the pace a bit until the end-of-summer slow down starting last week, and saw $8.4 billion over 17 deals. The 2020 YTD total now stands at $65.6 billion over 127 deals, well ahead of the full year totals in 2018 / 2019 of $41 and $42 billion respectively.¹
We expect the 2 weeks after Labor Day to be busy once again, as there is a relatively short period before most companies enter blackout at the end of the third quarter. - Terms. In the table below, we compare terms for July-August to previous periods both before and after the Covid-19 pandemic. Terms continue to improve from the dislocated levels in April, and are closing in on (but not quite back to) the pre-Covid-19 levels.
Similarly, the model value of terms was, based on marketing credit / volatility assumptions, 103.4% of par. This is a more issuer-friendly mark than the 104.4% average in Q2, but still somewhat elevated compared to a more typical ~102 longer-run norm.

- Day 1 Trading. Deals on average traded up +2.7 points on a stock-adjusted basis, a result that is quite high compared to a +1.5 Q2 2020 and long-run average — in coupon terms this suggests that an average of ~0.25% may have been “left on the table” by issuers in marketing. This occurred despite the fact that 17 of the 24 deals priced towards the issuer-friendly end of the range. With markets moving quickly, this is a good reminder that issuers need to keep pressure on their bookrunners during the marketing process to ensure that pricing is efficient; there is a natural tendency among banks to set price talk conservatively to avoid the risk that deals don’t work.
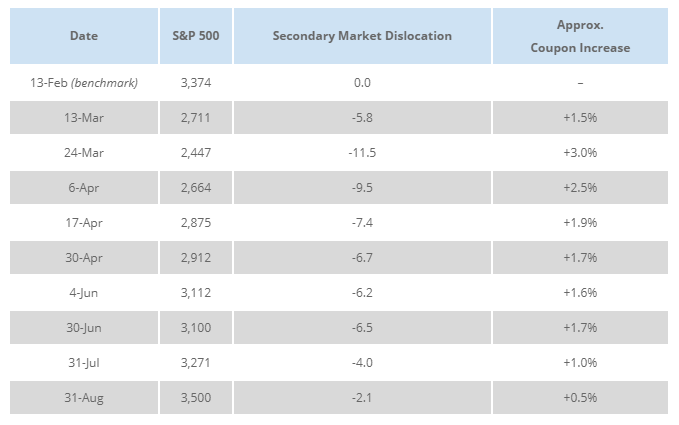
- Secondary Market. Finally, we are updating our data tracking that we launched earlier in the year tracking the dislocation in the convertible secondary trading market for a fixed universe of bonds since pre-Covid-19 in February. After a severe initial dislocation in late March / early April, trading levels have gradually recovered over the course of the summer.
While there has been some reallocation between technical valuation inputs (credit spreads remain wider than pre-Covid-19, and volatility is higher), the net effect on terms implied by trading levels are ~50 bps wider than pre-dislocation, roughly in line with what we have seen in the primary market.

Related Articles
April Convertible Market Review
June Convertible Market Review
