Matthews South

Matthews South

  • About Us
  • Our Solutions
    • Debt
    • Equity
    • IPO
    • Pre-IPO Financing
    • Convertible & Call Spread
      • Call Spread Unwind
      • Liability Management
    • Share Repurchases
      • Accelerated Share Repurchase (ASR)
      • Enhanced Open Market Repurchase (eOMR)
    • Capital Structure Review
  • Our Clients
    • Client List
    • Testimonials
  • Our Team
  • Video Library
  • Blog
  • Contact Us
  • Login

Q3 2021 Convertible Market Review

by Jake Levine | October 11, 2021 | Convertible & Call Spread, Market Review

As part of our market update series, please see the summary below of what we saw in the convertible market in Q3 2021.

  • New Issuance.  Q3 2021 saw 23 new issue convertible deals (22 debt & 1 mandatory) with dollar volumes of $15.0bn, compared to $17.0bn across 30 deals from Q2 2021 and $19.9bn across 39 deals in Q3 2020. More specifically, the majority of activity for the quarter came post labor day ($8.4bn across 14 deals), as issuers began to take advantage of a strengthening market before heading into black-out periods in October.

    The technology sector continues to be dominant in the market, accounting for 11 deals (48%), while healthcare was next most frequent with 4 deals (17%). Other sectors that were represented this quarter include Industrials, Financials, REITS, and Consumer Cyclical & Non Cyclical.

  • Terms.  As done previously, we compare the average convertible coupons and conversion premiums throughout recent history to capture any underlying trends. As seen below, terms remained relatively consistent with Q2, and are still attractive from a historical perspective. In the second table, we display the amount of zero-coupon deals over the past five years. It is worth noting that 46 out of the 60 zero coupon deals in 2020 and 2021 came from Q4 ‘20 and Q1 ‘21, and although the market has been constructive around these issues recently (3 deals in Q3), non-hedge investors continue to prefer yield amid the unprecedented zero coupon supply.

Sector 2019 Q1 2020 Q2 2020 Q3 2020 Q4 2020 Q1 2021 Q2 2021 Q3 2021
All Deals Avg.
2.20% / 30%
1.25% / 37%
2.53% / 29%
2.10% / 34%
1.14% / 38%
0.89% / 41%
1.15% / 35%
1.23% / 37%
Tech Sector Avg.
1.30% / 34%
1.04% / 37%
1.60% / 31%
1.22% / 39%
0.24% / 45%
0.15% / 46%
0.34% / 39%
0.58% / 42%
2017 2018 2019 2020 2021 YTD
All Deals
83
110
114
180
118
Zero Coupon
1
6
3
22
38
% of Zero Coupon Deals
1%
5%
3%
12%
32%
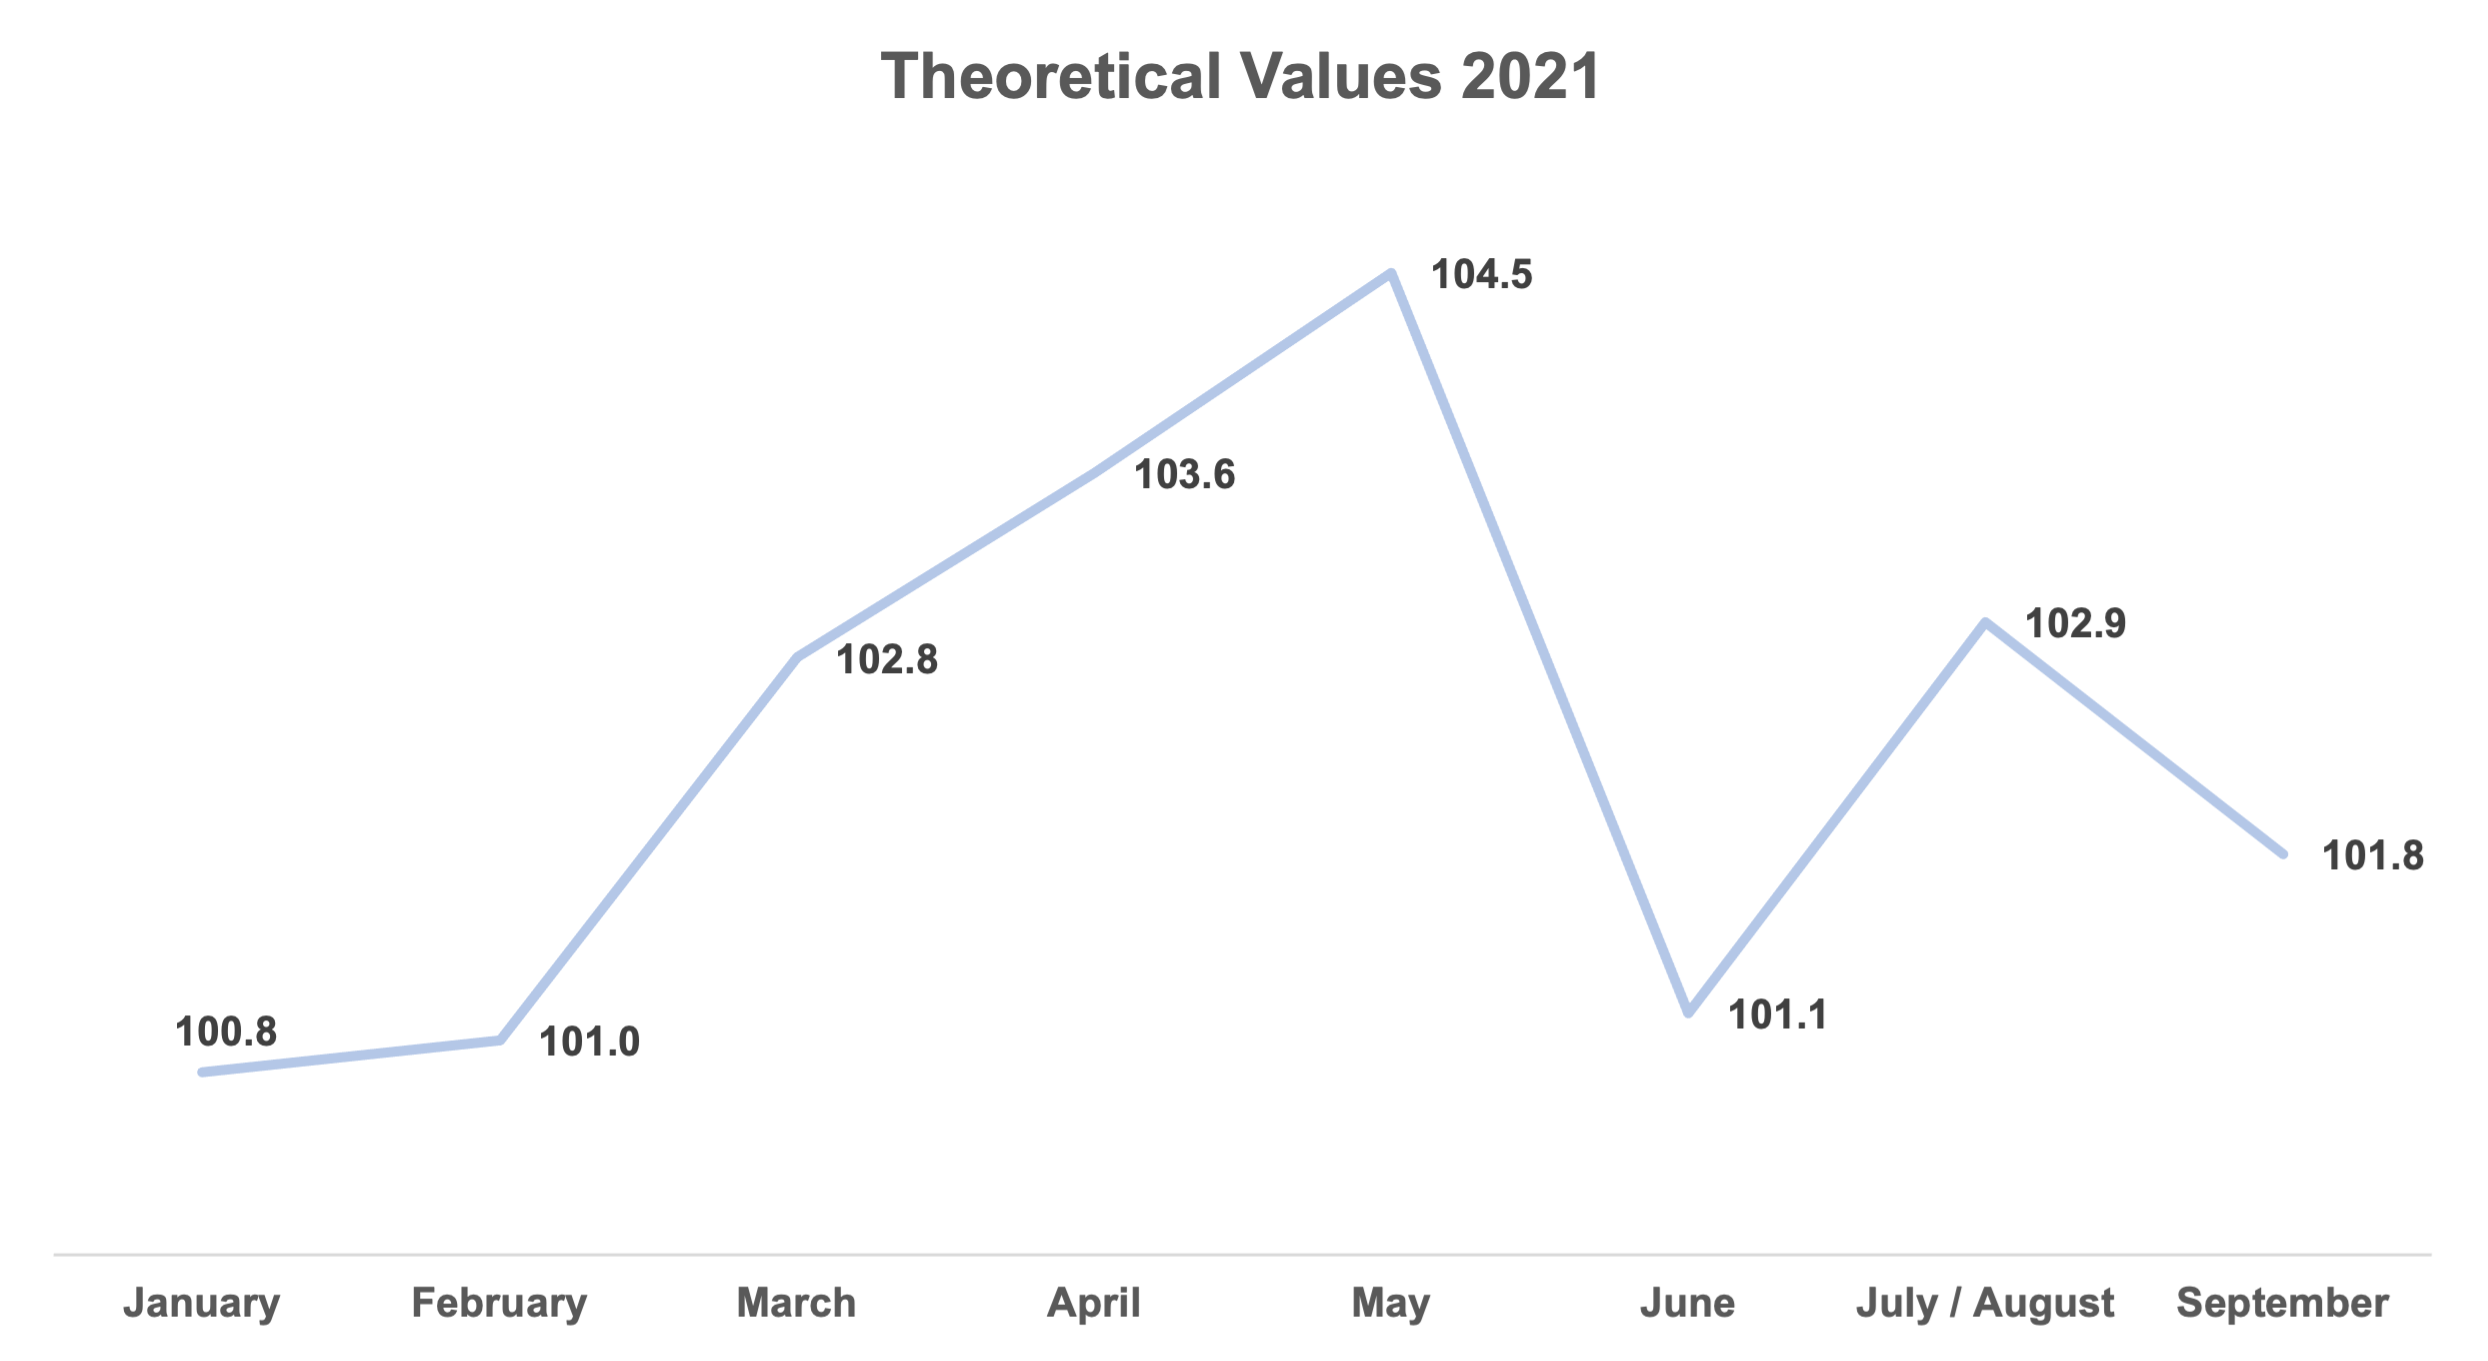
  • Pricing Results: Theoretical Value.  We have updated the theoretical value graph below with Q3 data (combined July and August given only one deal in July). Again, the theoretical value shows how much the typical deal was “worth” in a convertible value model based on the banks’ credit and volatility assumptions. The Q3 average of 102.3 was in-line with the 102 – 102.5% typical long run average on this metric.  Additionally, it is positive to see that the surge of supply in September was met with great investor receptivity, as deals priced much tighter on a theoretical value basis.

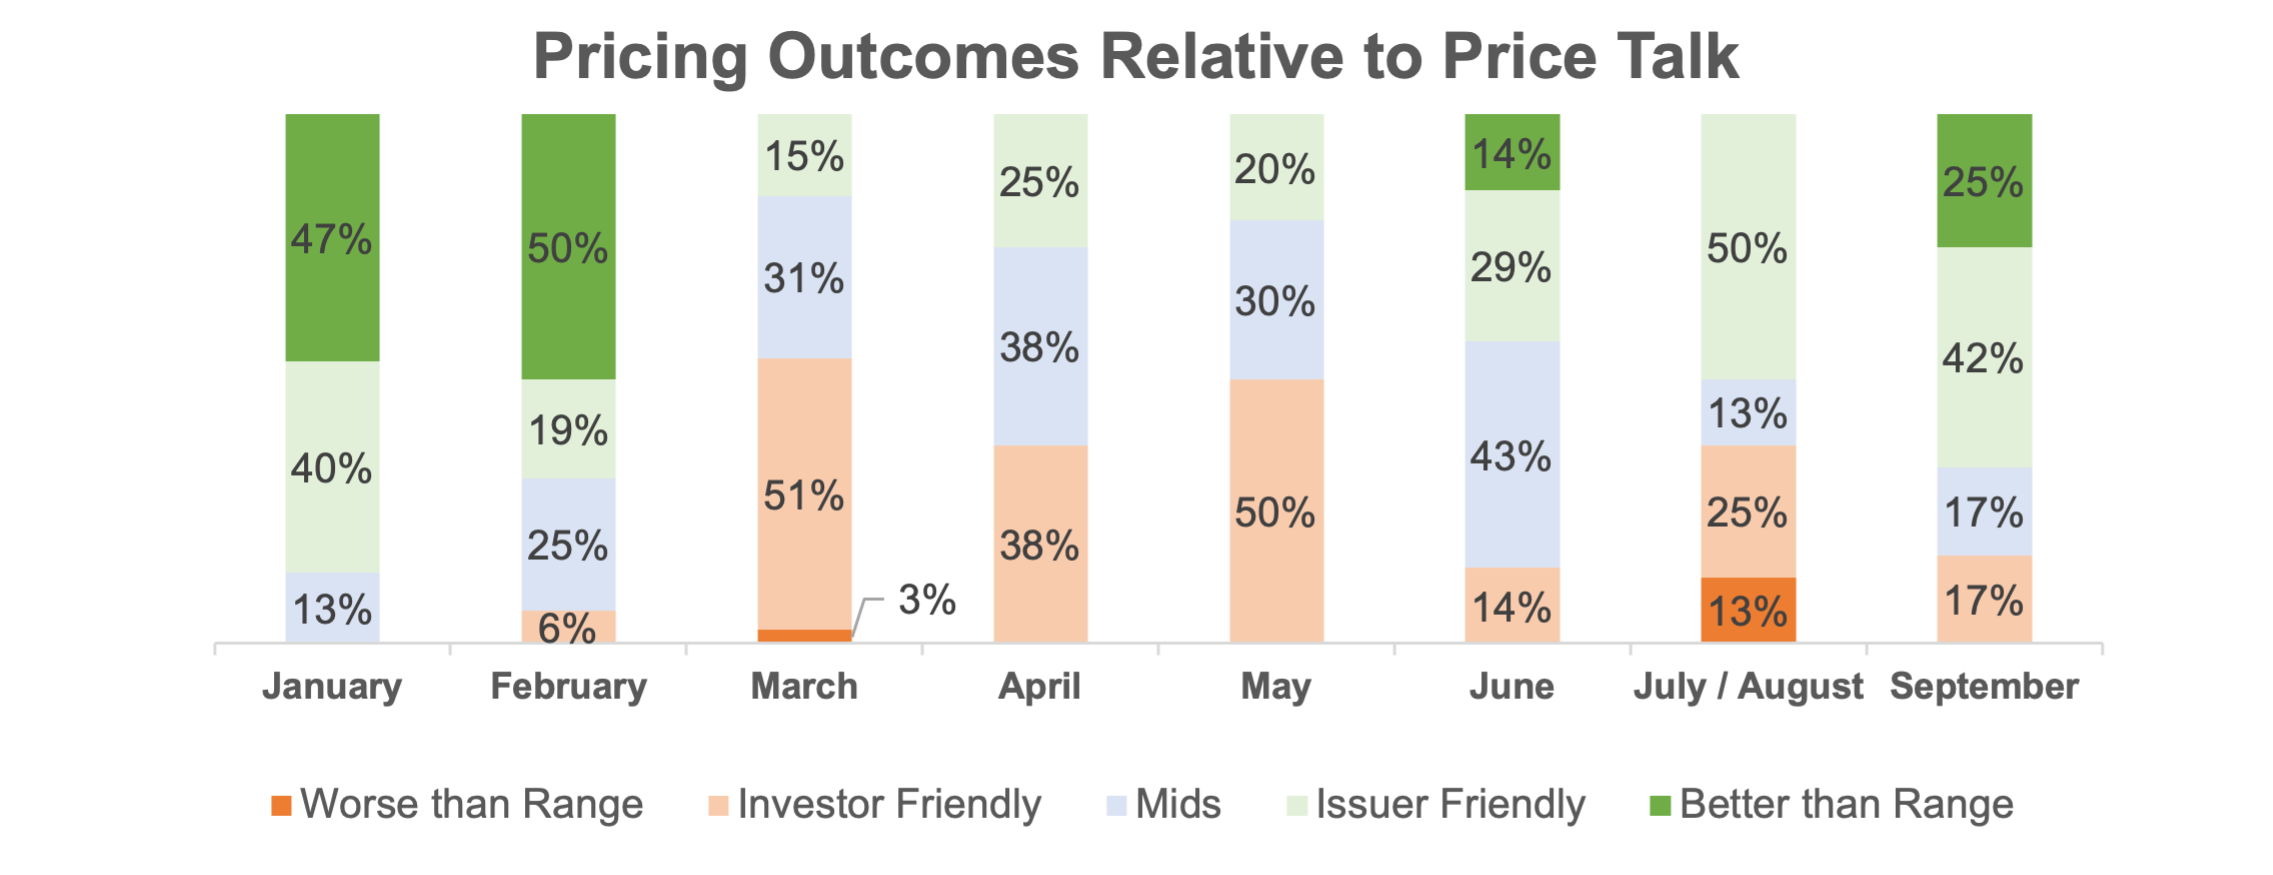
  • Pricing Results vs. Price Talk.   As expected, not only did deals begin pricing on a tighter theoretical basis, but also more commonly priced toward the “Issuer Friendly” side of the marketing range. The two marketed deals that priced toward the “Investor Friendly” end of the range came during the first true week of issuance in September, representing how the market strengthened throughout the month.

  • Day 1 Trading.  On average, for the quarter, deals traded up 2.0 points on a stock-price adjusted basis on the first day of trading (1.8 points in July / August and 2.1 points in September), compared to an average since May 2020 (post COVID) of ~1.7. This does signify that issuers left slightly more money on the table in September than they did earlier in the quarter.  However, it may mean that price talk ranges set by issuers and banks “lagged” the strength of the market: investors were slightly more receptive to new issuances than the issuer side expected.   Thus issuers this coming quarter may be able to tighten terms into the strength if it continues.
Related Articles

Q1 2021 Convertible Market Review

Q2 2021 Convertible Market Review

Q4 2021 Convertible Market Review

Filed Under: Convertible & Call Spread, Market Review

Contact Us

To learn more about our solutions or to schedule a demo of our software, please contact us by filling out the form below, or email us at info@matthewssouth.com.


    • Matthews South LLC is a member of FINRA and SIPC
    • Brokercheck
    • © Matthews South, Inc. 2024
    • Privacy Policy
    • Additional Disclosure
    • Testimonials may not be representative of the experience of other customers and are not a guarantee of future performance or success