
As part of our market update series, please see the summary below of what we saw in the convertible market in Q2 2021.
- New Issuance. Q2 2021 saw 30 new issue convertible deals (25 debt & 5 mandatory/preferred) with dollar volumes of $16.8bn, compared to $41.3bn across 74 deals from Q1 and $54.4bn across 90 deals in Q2 2020. Although this quarter’s volume may seem low given what the market has experienced over the past year, a $67.2bn annualized level would be on the high end of a typical range of new issuance volume in the convertible market.
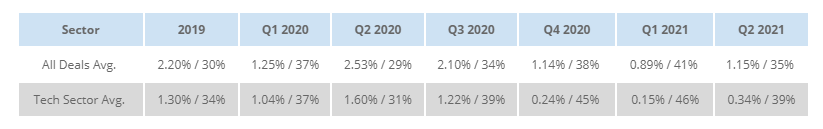
Although Tech was still responsible for the highest share of deals with 8 (27%), issuance among sectors was more balanced, as Consumer Cyclicals, Industrials, and Utilities were responsible for 7 (23%), 5 (17%), and 4 (13%) deals, respectively. - Terms. As done previously, we compare the average convertible coupons and conversion premiums throughout recent history to capture any underlying trends. While the data seems to show that the market likely peaked in Q1 2021, the terms achieved in Q2 2021 are still at historically attractive levels.
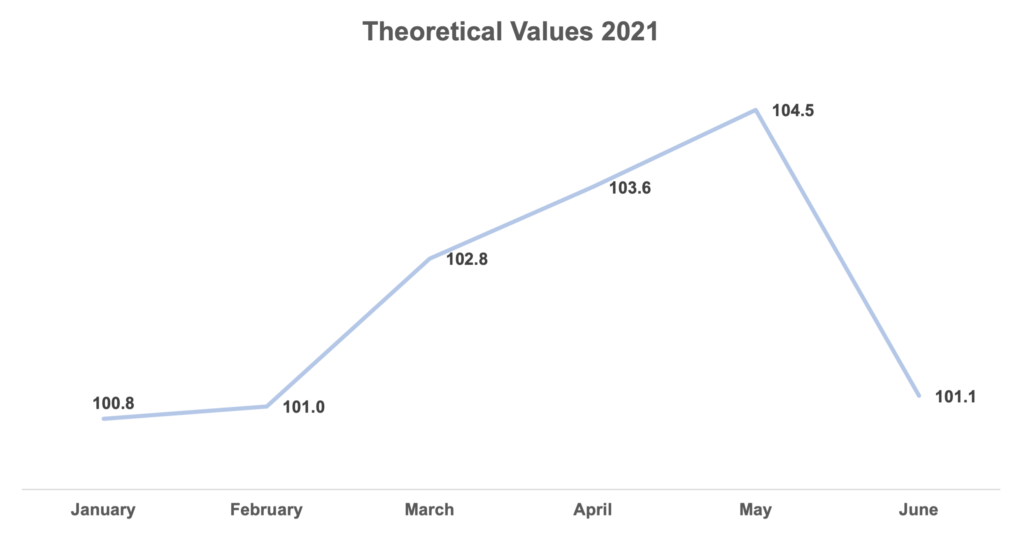
- Pricing Results: Theoretical Value. The graph below reflects the change in theoretical value (i.e. showing how much the typical deal was “worth” in a convertible value model based on the banks’ credit and volatility assumptions) over the course of Q2. Convertibles averaged ~103.2% of par for the last two weeks of March, as seen in our previous blog, and continued to price wider on a theoretical value basis through the end of May as the market remained bruised from the heavy supply (and losses on a number of Q1 deals). However, based on the below data, the market improved in June as new deals priced, on average, with a theoretical value of 101.1% of par. These levels compare to a typical long run average of ~102-102.5%
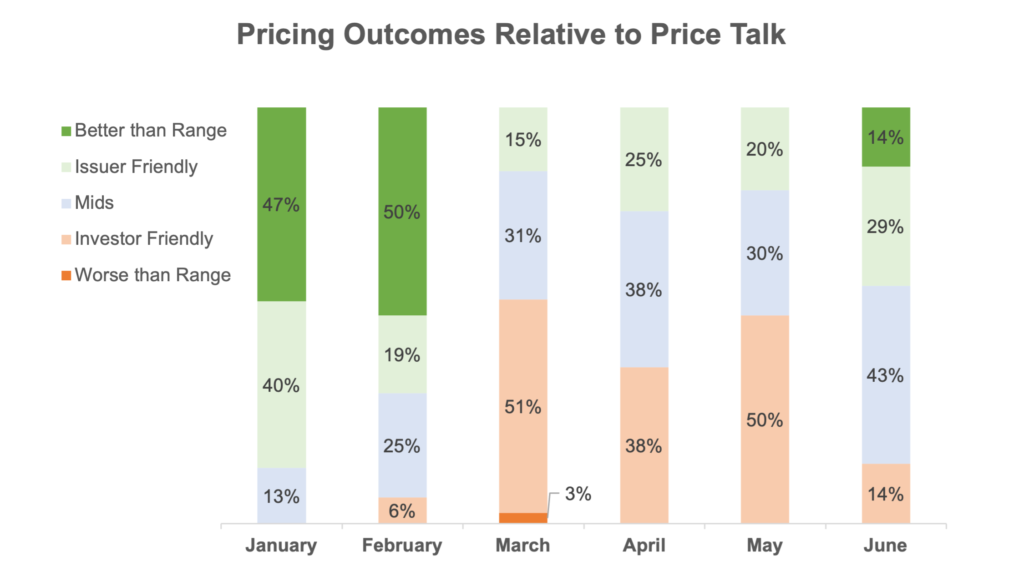
- Pricing Results vs. Price Talk. The chart below displays where deals ended up pricing relative to the initial ranges that they were marketed with. As expected, when the market continued to widen coming out of Q1 into April and May, more deals priced towards the “Investor Friendly” side of the range. Once again however, June was better, with more deals pricing at the “Issuer Friendly” side of the range.
- Day 1 Trading. On average, for the quarter, deals traded up 1.2 points on a stock-price adjusted basis on the first day of trading. However, when we break this down on a monthly basis, we see that deals traded up by 1.6, 1.2, and 0.7 points for April, May, and June respectively. The more the convertible trades up the following day on a stock-price adjusted basis, the more money the issuer “left on the table”. This data supports our view that the market improved for issuers in June, as investors were willing to accept a lower new issue concession for investing in these offerings.
Related Articles
Q1 2021 Convertible Market Review