As part of our market update series, please see the summary below of what we saw in the convertible market in Q1 2021.
- New Issuance. Q1 2021 saw 74 new issue convertible deals (70 debt & 4 mandatory) with dollar volumes of $41.3 billion, compared to $13.2bn across 22 deals in Q1 2020. Additionally, March 2021 became the highest volume month of all time with $23.5bn issued. Looking back over the past 4 quarters, convertible supply has topped $135.1bn, more than doubling the typical annual supply of ~$40-60bn.
Activity was dominated last quarter by the Tech / Healthcare / Consumer Cyclical sectors, representing 34 (46%), 12 (16%), and 12 (16%) of the deals, respectively.
- Terms. In the table below, we compare terms for Q1 with previous quarters going back to 2019 in order to capture how convertible coupons and conversion premiums have trended. The market continued to offer issuers very attractive pricing, even strengthening from the historical levels seen during Q4. This quarter saw ~44% of its deals price with a 0% coupon, and witnessed a market that was temporarily receptive to a 70% conversion premium. Expedia, for example, raised $1bn at 0% coupon and 72.5% conversion premium.

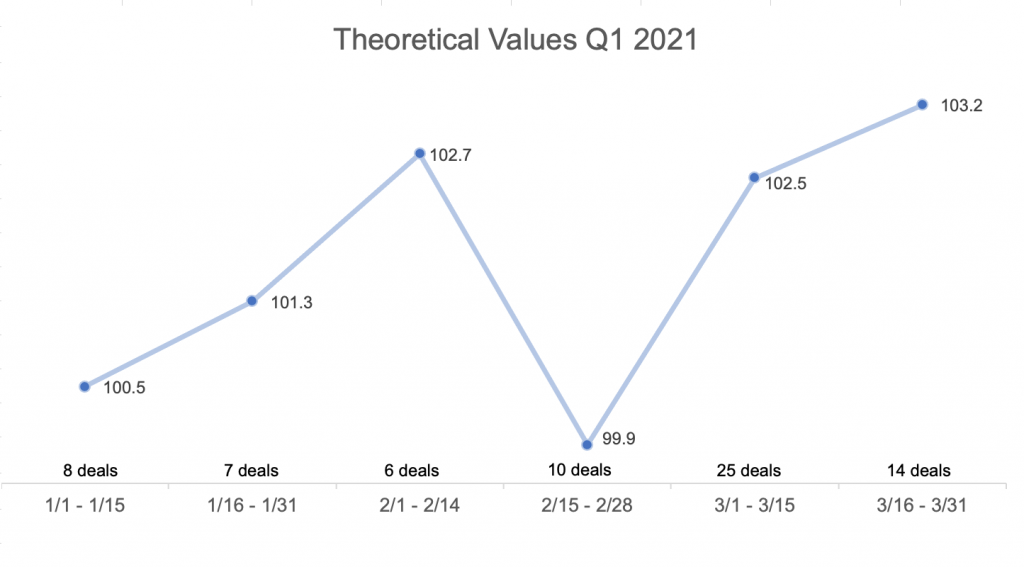
Pricing Results: Theoretical Value. The first graph below shows trends in theoretical model valuation throughout the quarter — i.e., showing how much the typical deal was “worth” in a convertible value model based on the banks’ credit and volatility assumptions. In the months of January and February, the average value was 100.9% of par (and in the second half of February, slightly below par), a historically very aggressive level. In March, the market became more conservative after the volume of supply, with theoretical value averaging 102.8% of par. These levels compare to a pre-COVID average of ~102.4% (2017 – 2019).

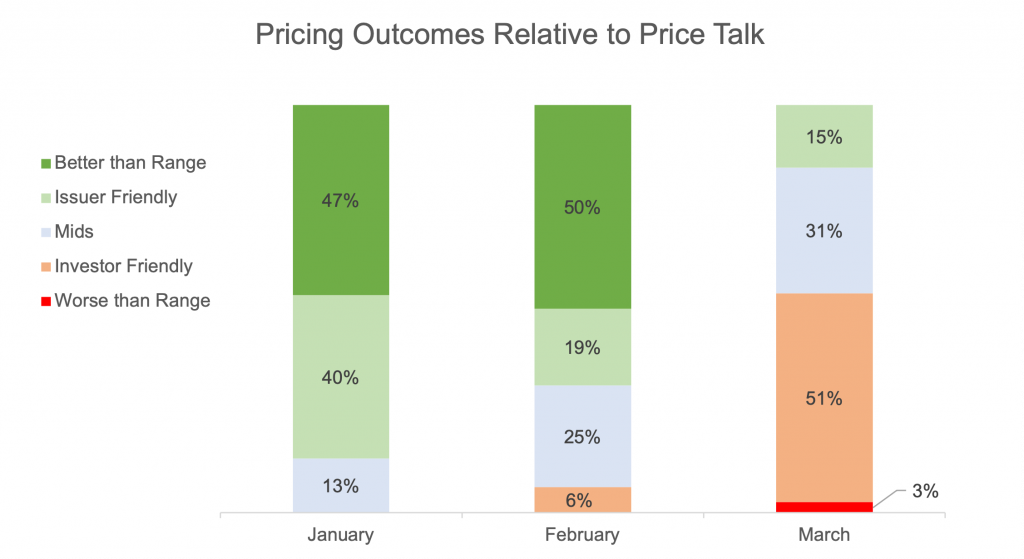
Pricing Results vs. Price Talk. The chart below shows where deals priced at various points in the quarter relative to initial marketing ranges. January and February saw the majority of deals price at the “tights” or issuer-friendly end of the range, including many deals better than the range. March reversed this trend with a majority of deals pricing at the issuer-unfriendly end of the range (or worse), in a signal of fatigue from the record levels of issuance.

Day 1 Trading. Deals traded up +2.0 points on a stock-price adjusted basis on the first day of trading, slightly higher than the long term average of ~1.5 points. Additionally, deals pricing with a 0.00% coupon and at least a 60% conversion premium also averaged +2.0 points on an adjusted basis, signaling investor receptivity to these pricing optics. However, deals that priced in March traded up only +1.3 points compared to those in January and February that traded up +2.9 points (despite higher theoretical values for deals in March), again signaling some market fatigue from the increased supply.
Related Articles
Q2 2021 Convertible Market Review
