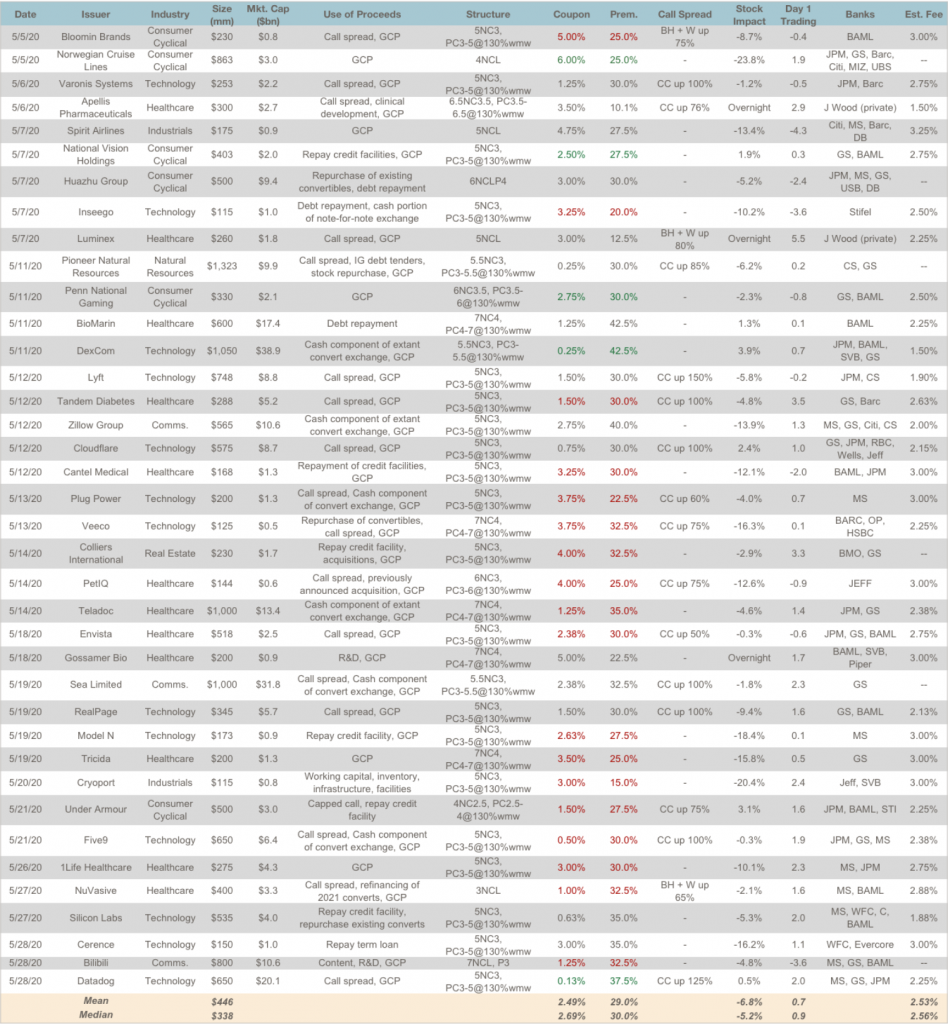
As part of our market update series, please see the summary below of what we saw in the convertible market in May. Additional details on all the deals are in the attached.
- New Issuance. The heavy pace of April accelerated in May, with $17 billion of convertible debt issuance over 38 deals in the U.S. primary market. This brings the 2020 total through May to $40.5 billion, compared to $42 billion in 2019 (in the first week of June, the 2019 total has now been surpassed). Sector breakdown was very diverse, with 16 deals in Technology / Communications, 12 in Healthcare, 6 in Consumer Cyclical, 3 in Industrials, and 1 in Real Estate.
- Terms. In the table below, we compare terms for May deals to April, Q1 2020 and 2019. Terms improved on the margin from April as markets recovered, but remained dislocated from pre Covid-19 levels. Tech companies, relatively more insulated from direct pandemic impact, have experienced less dislocation than other sectors.

- Day 1 Trading. After seeing bonds trade up 2.6 points on average in April, that statistic was much lower in May — with bonds on average trading up only 0.7 points and almost 30% of deals (11 of 38) trading down on the first day. This reflected some market saturation, as nearly a full year of issuance had to find a home within a 2-month period.
This occurred despite the average model value of the new bonds being ~104.7% of par based on banks’ marketing inputs. This level was similar to April (104.6) but dislocated from a more normalized 102.7 / 102.3 from Q1 2020 / 2019. - Call Spreads. Call spread usage remained relatively lower than pre-Covid-19 (48% vs. 63% Q1 / 55% 2019). Like April, this reflects the shift towards balance sheet repair / maximizing proceeds. Pricing remained somewhat wider than pre-Covid-19 periods as well, for market supply reasons similar to the dynamic reflecting convertible bond pricing and trading levels.
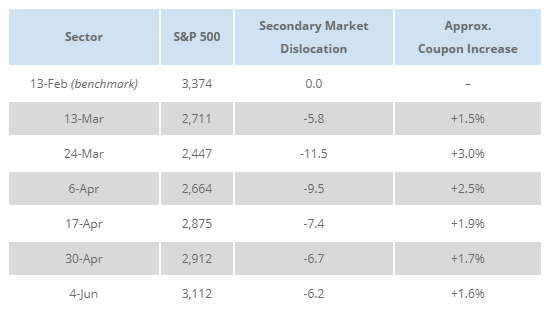
- Secondary Market. Finally, we are updating our data tracking the dislocation in the convertible secondary trading market for a fixed universe of bonds since February. After a severe dislocation in the last week of March / first week of April, trading levels have been relatively stable in the last several weeks, settling at levels that imply around a ~1.7% coupon increase in new issuance (for an equivalent conversion premium).

Related Articles
