
As part of our market update series, here are our takeaways in the convertible market in Q4 2023 and looking across the year.
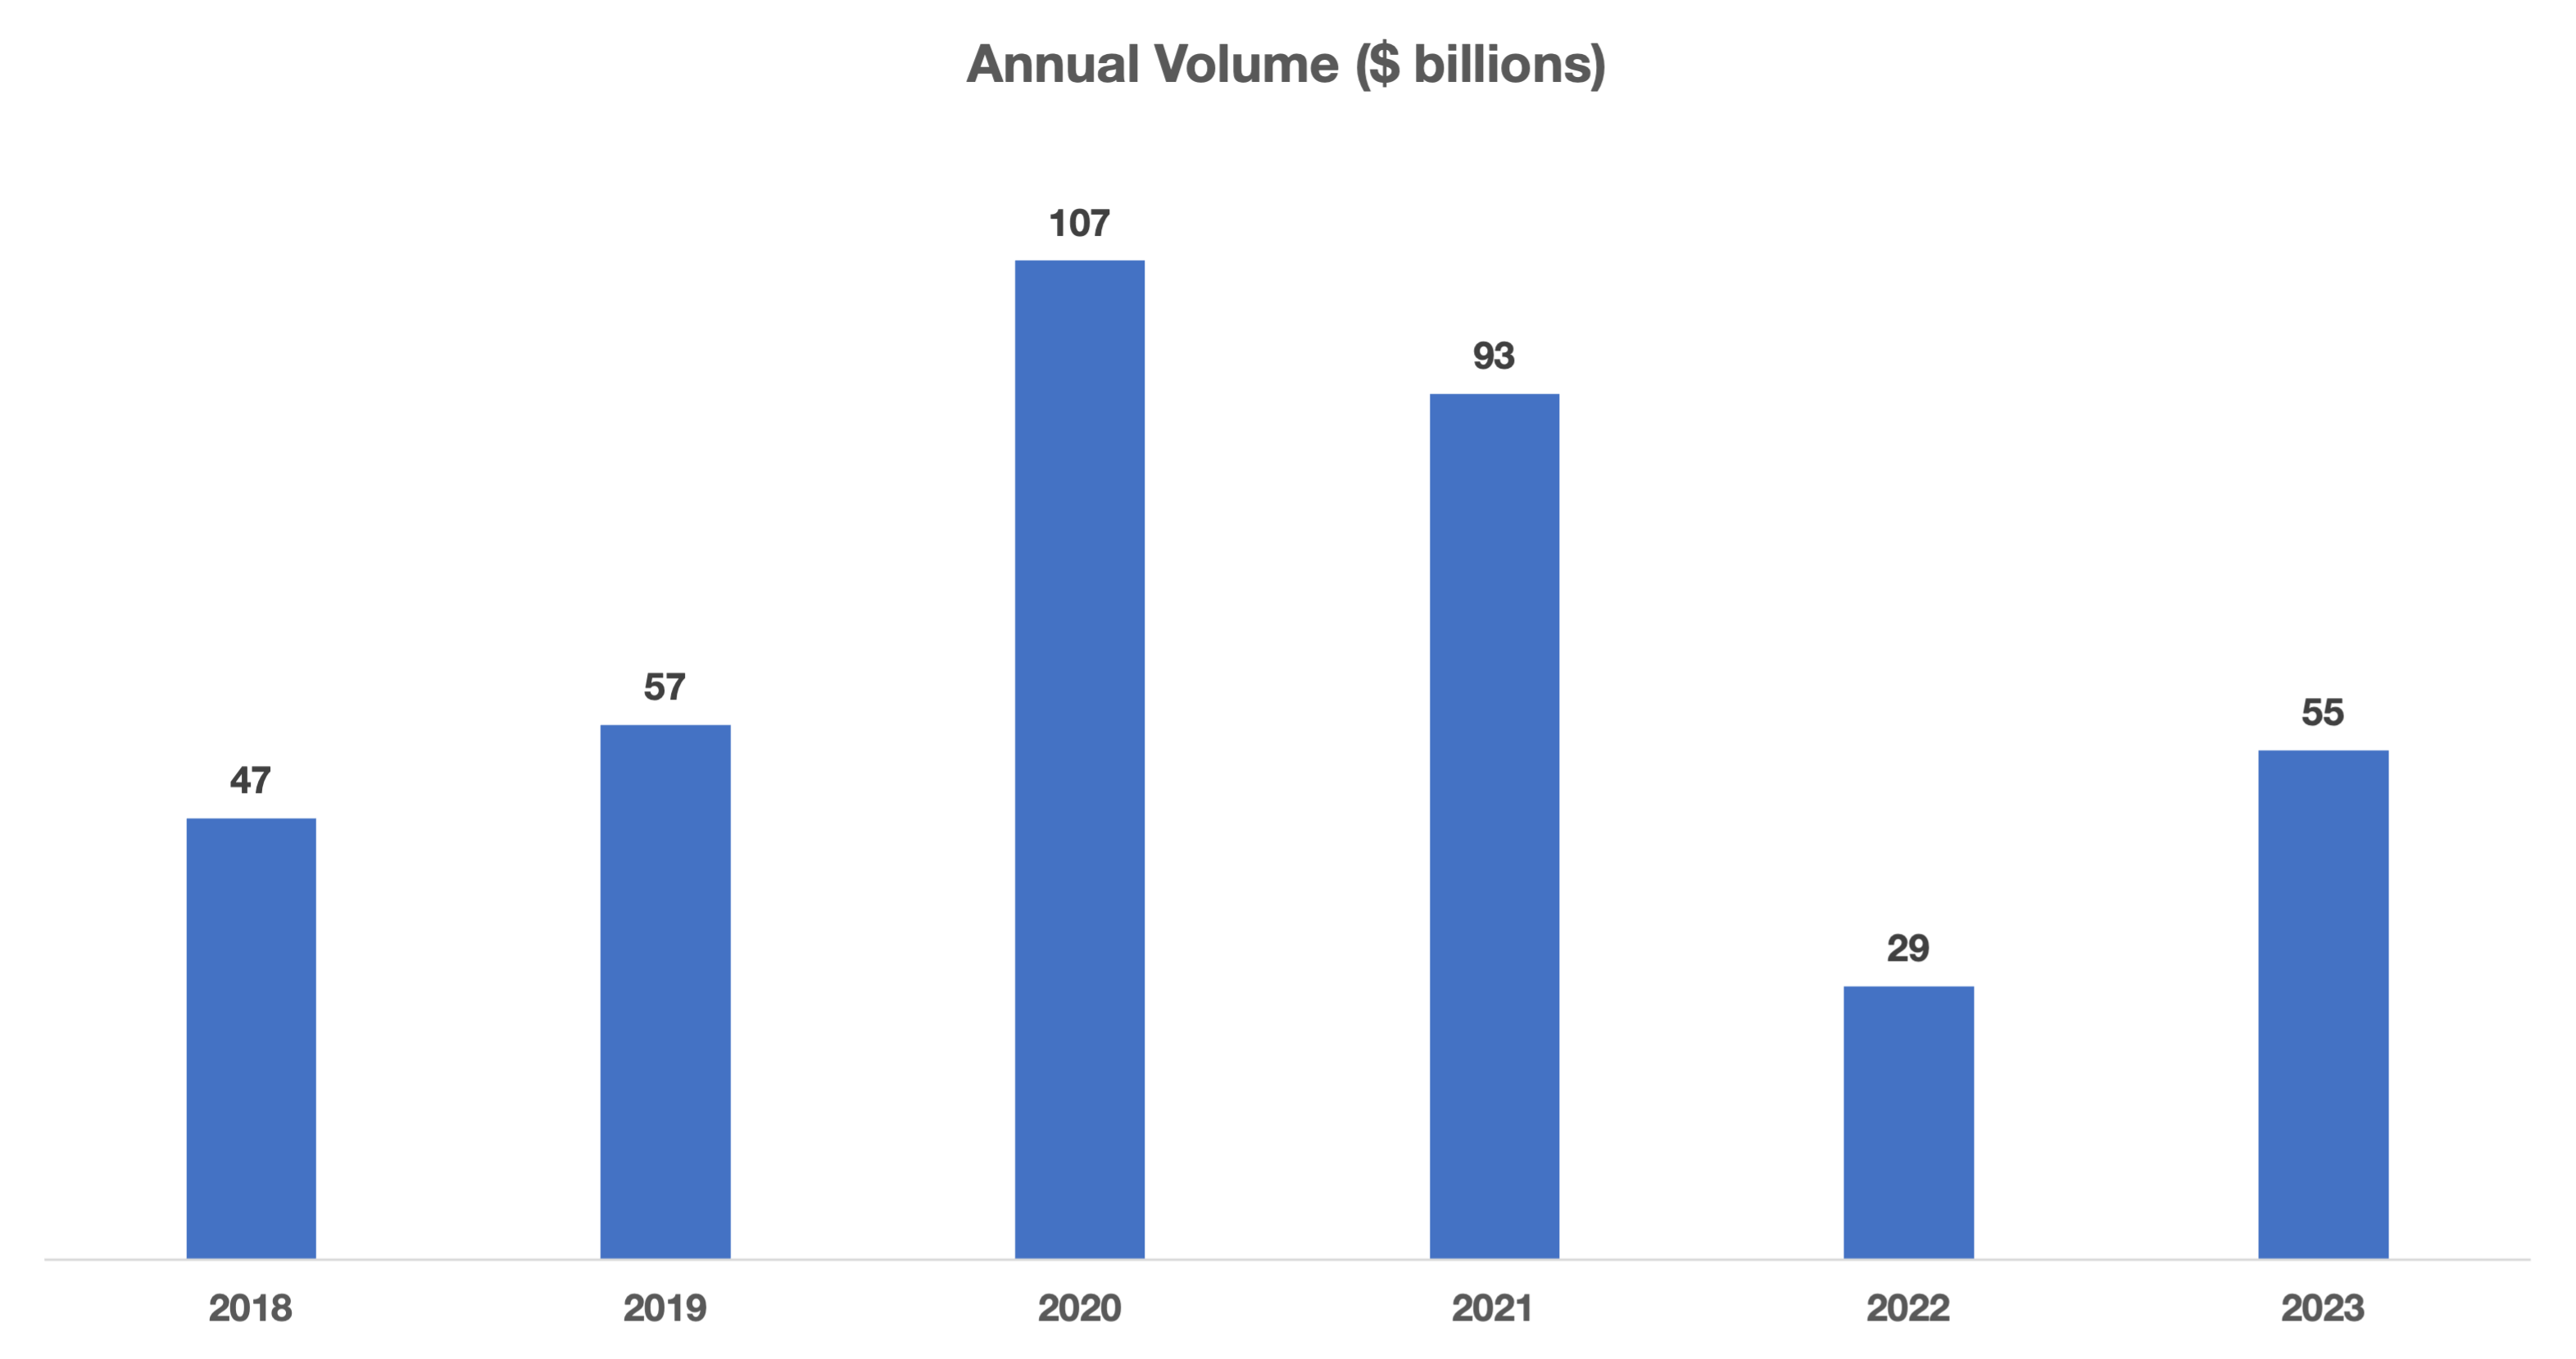
- Convertible market ended 2023 with another active quarter with ~$13 billion of new issuance activity. 2023 new issuance volume finished at ~$55 billion, which is a strong rebound from ~$29 billion in 2022.
- A growing number of investment-grade rated companies raised capital in the convertible market in 2023 to take advantage of the favorable EPS impact relative to straight debt.
- Technology was the most active sector by number of deals in 2023, which reflects a quick recovery from the 2022 selloff in that sector.
- The relative attractiveness of convertible coupons compared to straight debt is now much higher notwithstanding rising interest rates resulting in higher coupons (~3.50% average coupon) and lower conversion premiums (~28% average conversion premium) than in 2022.
New Issuance: Q4 2023 saw 17 new issue convertible deals with a total volume of $12.6 billion, which brought total 2023 issuance to $54.6 billion across 88 deals. The convertible market had two of the three busiest years on record (2020 & 2021) followed by an inactive year in 2022. In 2023 the convertible market normalized with volumes roughly in line with pre-Covid historical levels. Average deal size in Q4 is ~$745 million, which was higher than the ~$590 million average through the first three quarters this year.
Issuers came from a steady mix of sectors. Technology and Healthcare led the pack with five and four deals with volumes of $4.1 billion and $2.2 billion, respectively, followed by deals from Communication Services, Industrials and Utilities, and Consumer Cyclicals.
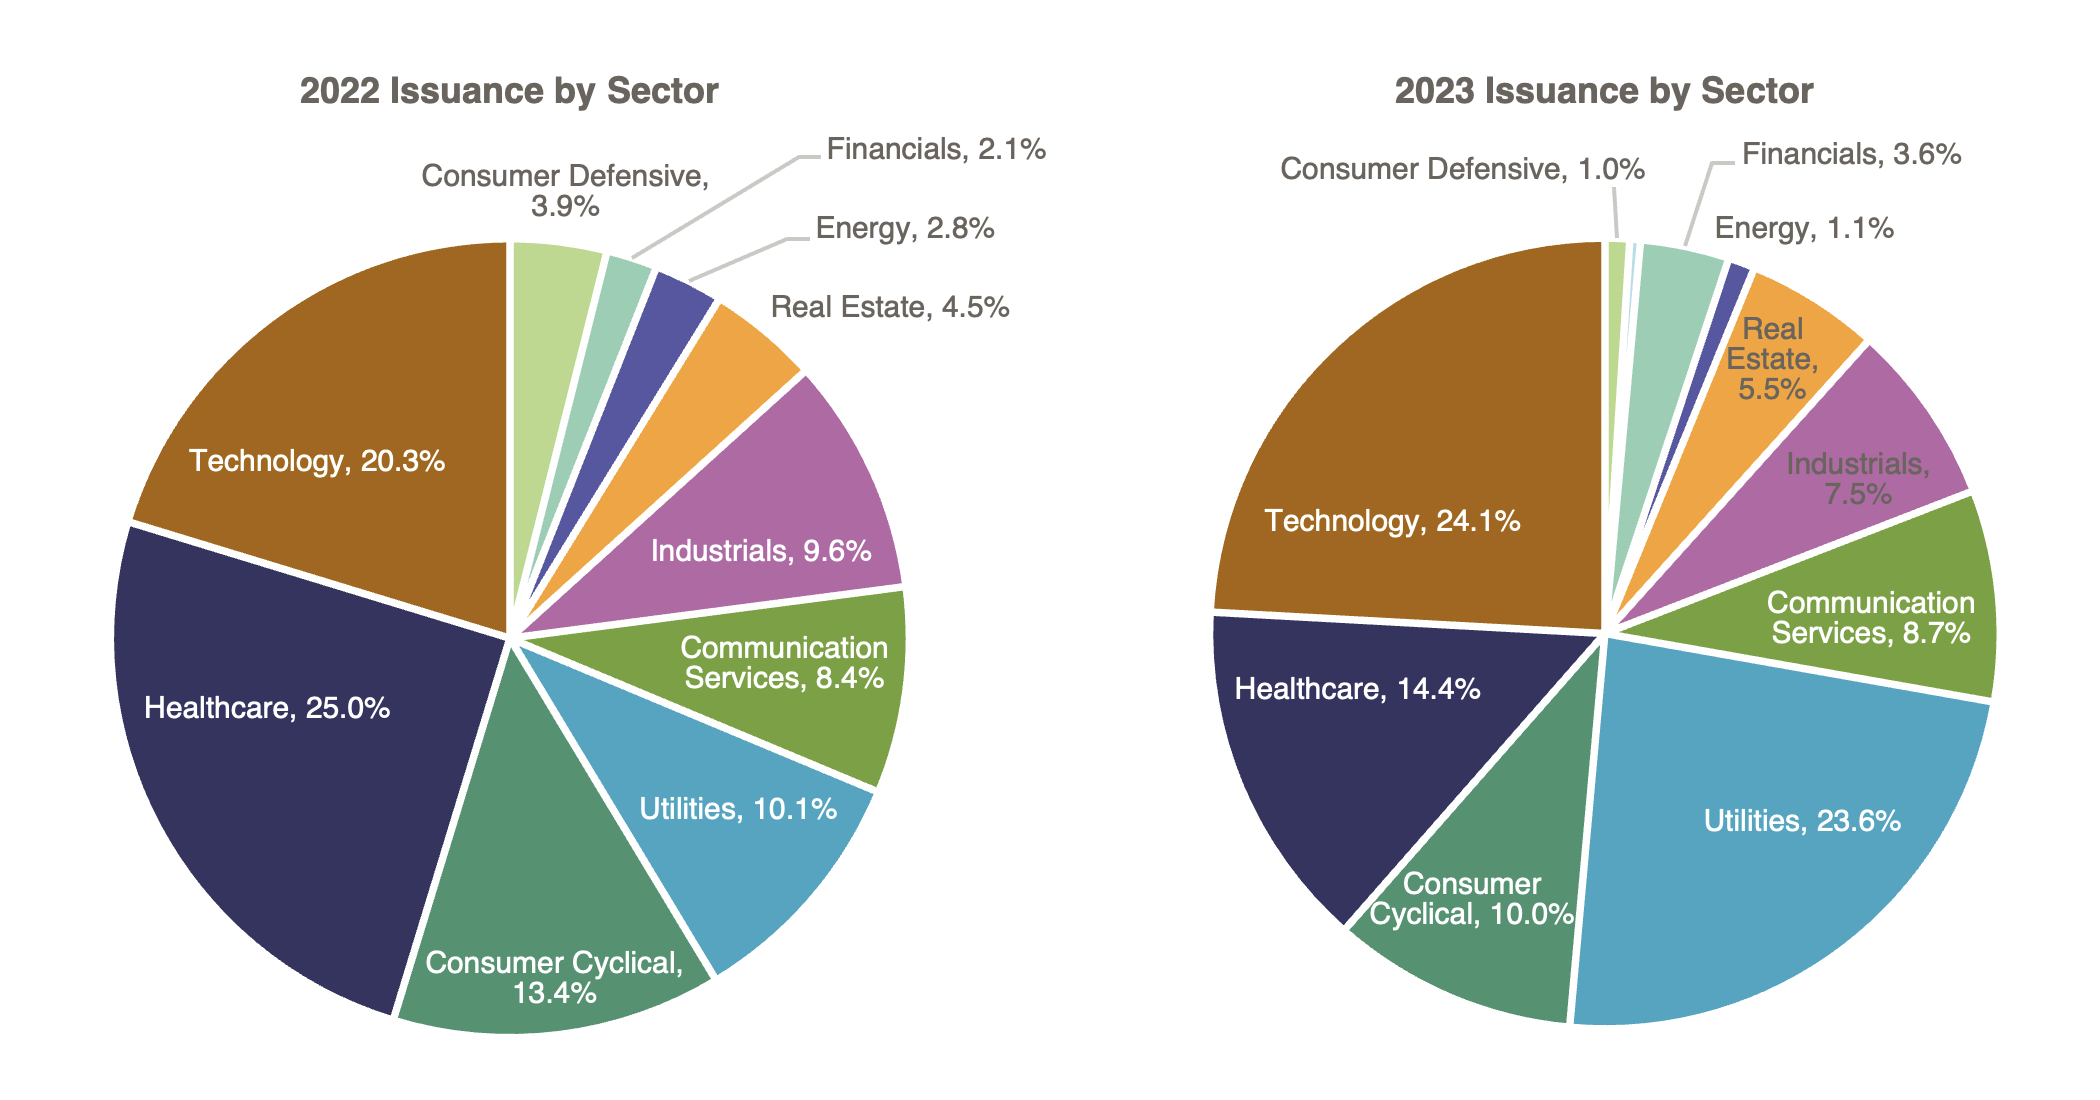
For 2023 as a whole, there were 21 Technology deals (24% of total) worth $13.2 billion (24% of volume). In 2022, the sector accounted for 25% and 20%. Healthcare, historically the second busiest sector, was responsible for 13 deals (15%) for $6.1 billion (14%), an increase from its proportions of 13% deals / 25% proceeds in 2022.
Terms: Given the rise in rates throughout Q4, convertible terms (specifically coupons) widened; however, the increase in coupons were only a fraction of the increase in the rates themselves. Similar patterns emerged for technology and healthcare companies as new coupons were higher and new conversion premiums were lower compared to previous quarters.
Average New Issue Coupon Rate and Conversion Premium 2021-2023
| Sector | 2021 | 2022 | 2023 | Q4 2023 |
|---|---|---|---|---|
|
All Deals |
1.42% / 37% |
3.45% / 29% |
3.50% / 30% |
3.66% / 29% |
|
Technology |
0.39% / 42% |
2.68% / 31% |
2.80% / 27% |
2.93% / 27% |
|
Healthcare |
1.59% / 34% |
3.08% / 30% |
2.56% / 30% |
2.84% / 34% |
|
Average 5y UST |
0.86% |
3.01% |
4.07% |
4.44% |
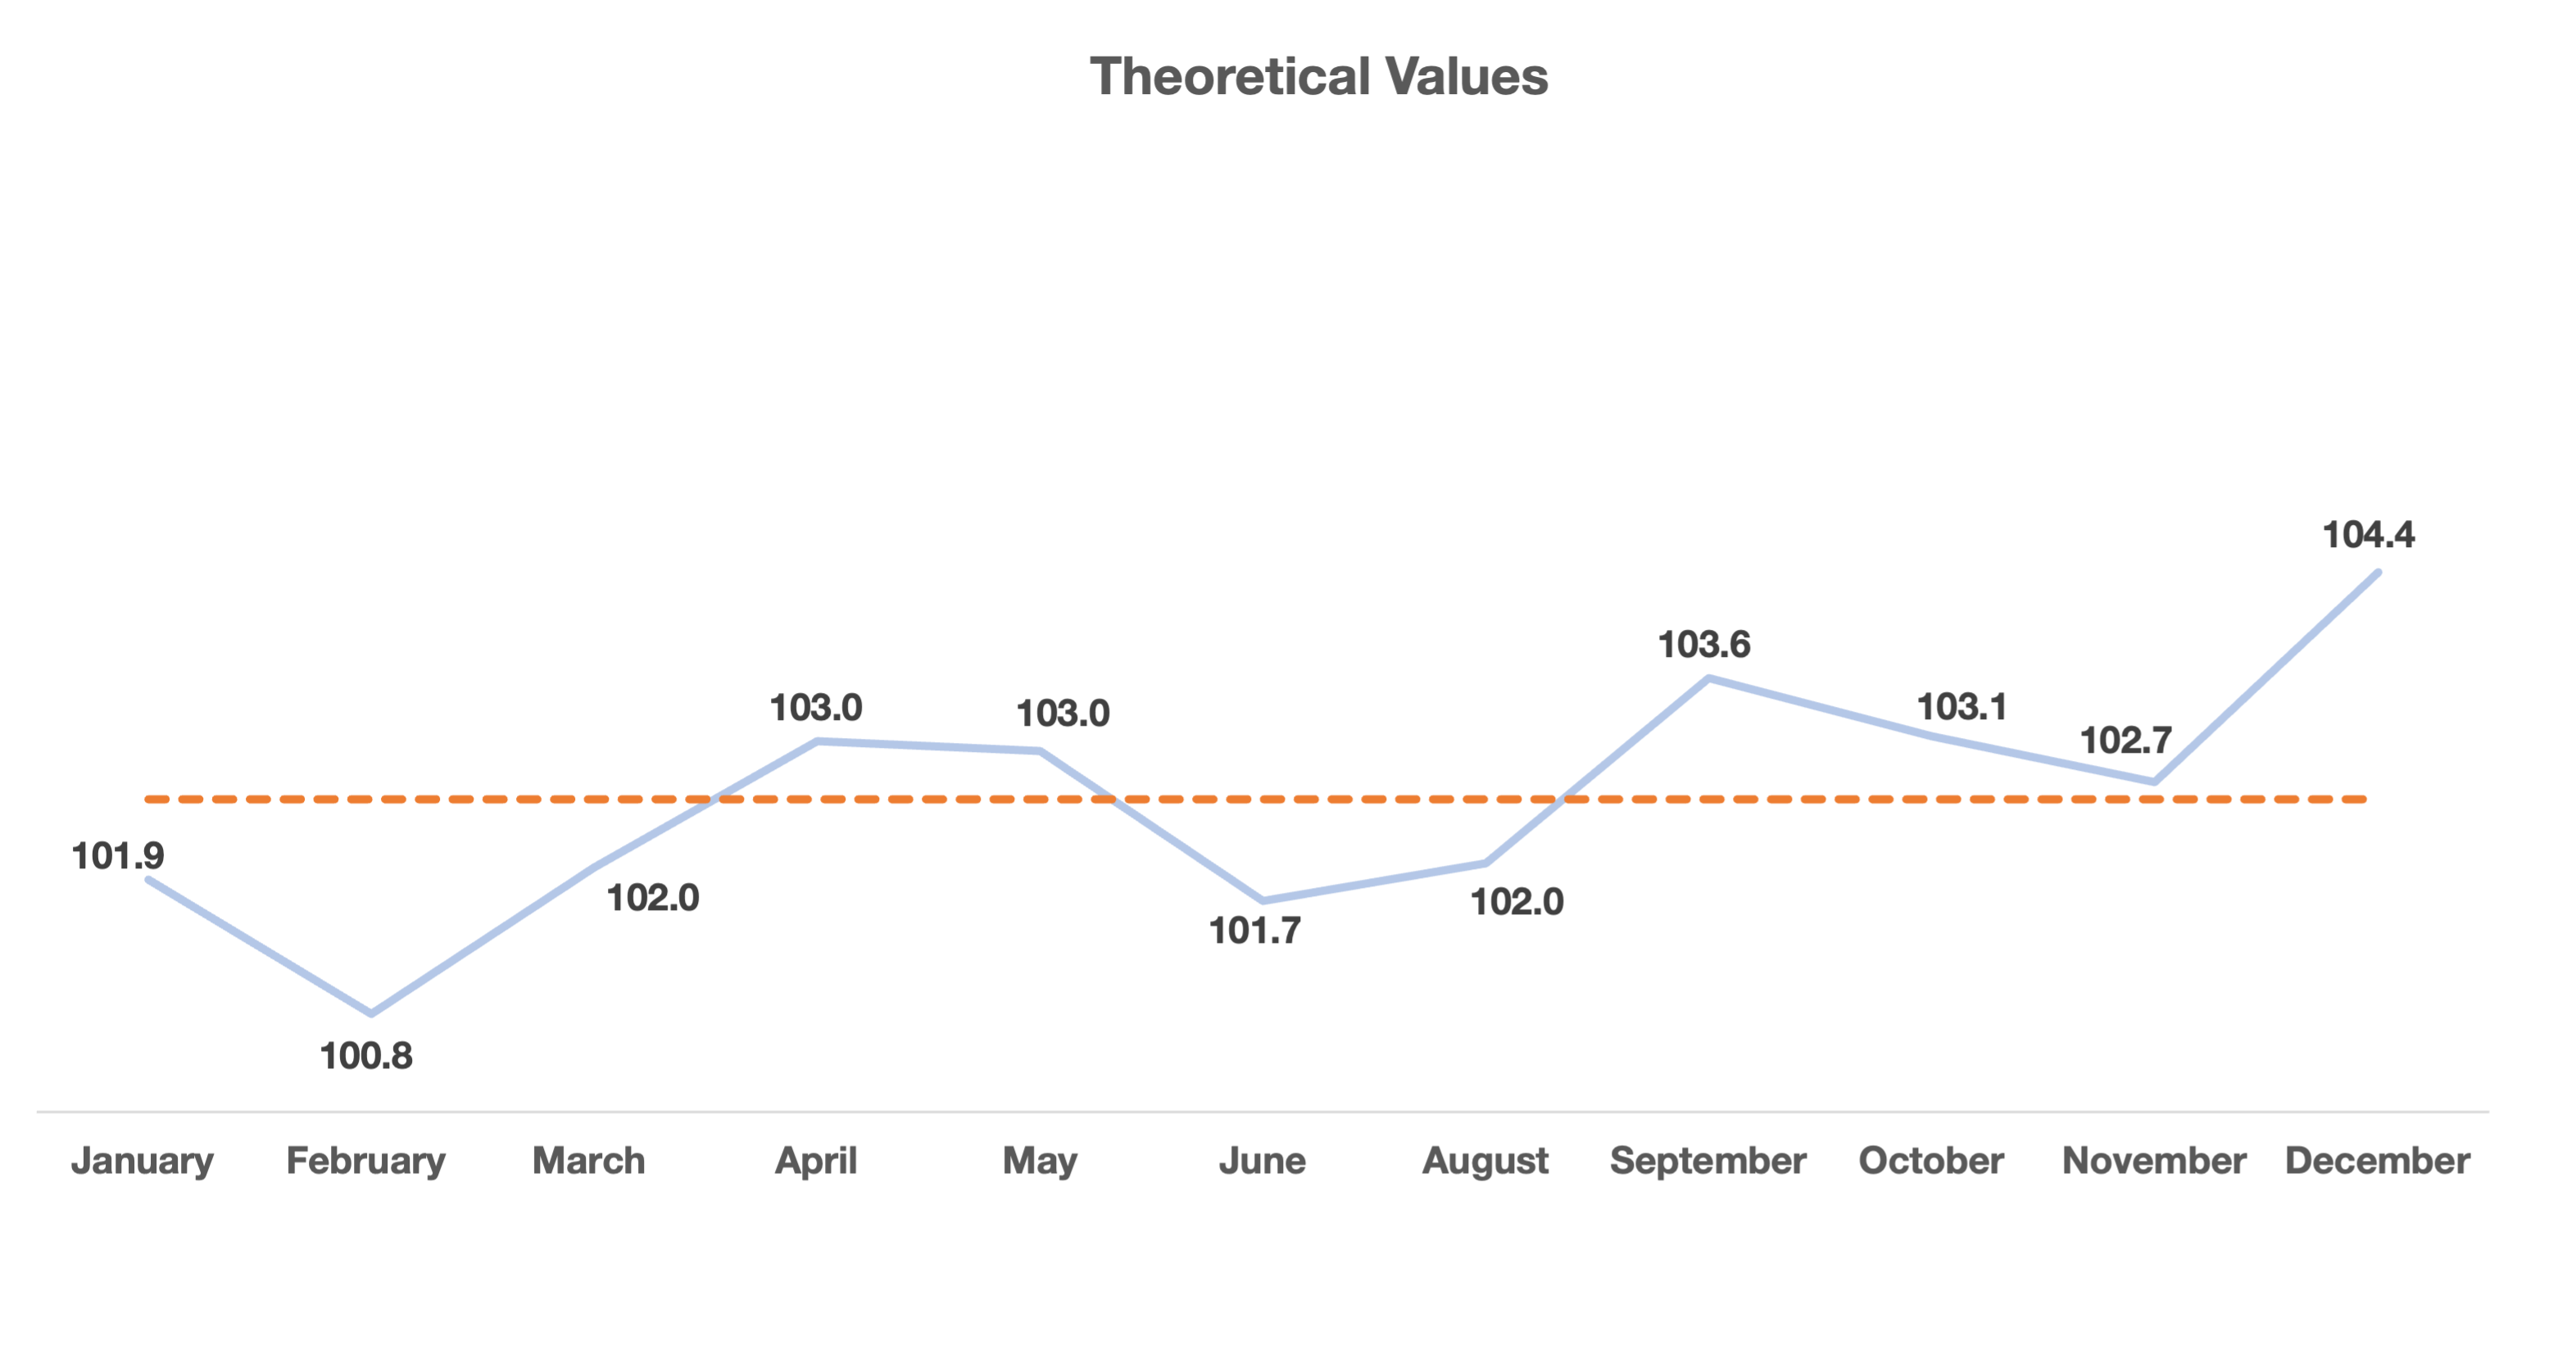
Pricing Results: Theoretical Value: The graph below shows how much cheapness was priced into deals throughout 2023. The Q4 average was 103.4, which is a little above the 2023 average of 102.6. Looking at this chart and the previous table, it may be reasonable to conclude that despite year-end rally across major indices, convertible deals were actually priced more conservatively.
Personal Views: The views expressed in this report reflect our personal views. This blog post is based on current public information that we consider reliable, but we do not represent it is accurate or complete, and it should not be relied on as such. The information, opinions, estimates and forecasts contained herein are as of the date hereof and are subject to change without prior notification. The large majority of reports by us are published at irregular intervals as appropriate in our judgment and ability to produce, so updates may not be made or available even when circumstances may have changed.
No Offer: This analysis is not an offer to sell or the solicitation of an offer to buy any security in any jurisdiction where such an offer or solicitation would be illegal. It does not constitute a personal recommendation or take into account the particular investment objectives, financial situations, or needs of individual clients. You must make an independent decision regarding investments or strategies mentioned on this website. Before acting on information on this website, you should consider whether it is suitable for your particular circumstances. You should not construe any of the material contained herein as business, financial, investment, hedging, trading, legal, regulatory, tax, or accounting advice. The price and value of investments referred to in this analysis and the income from them may fluctuate. Past performance is not a guide to future performance, future returns are not guaranteed, and a loss of original capital may occur.