
As part of our market update series, please see the summary below of what we saw in the convertible market in Q4 2022 along with some year-end takeaways.
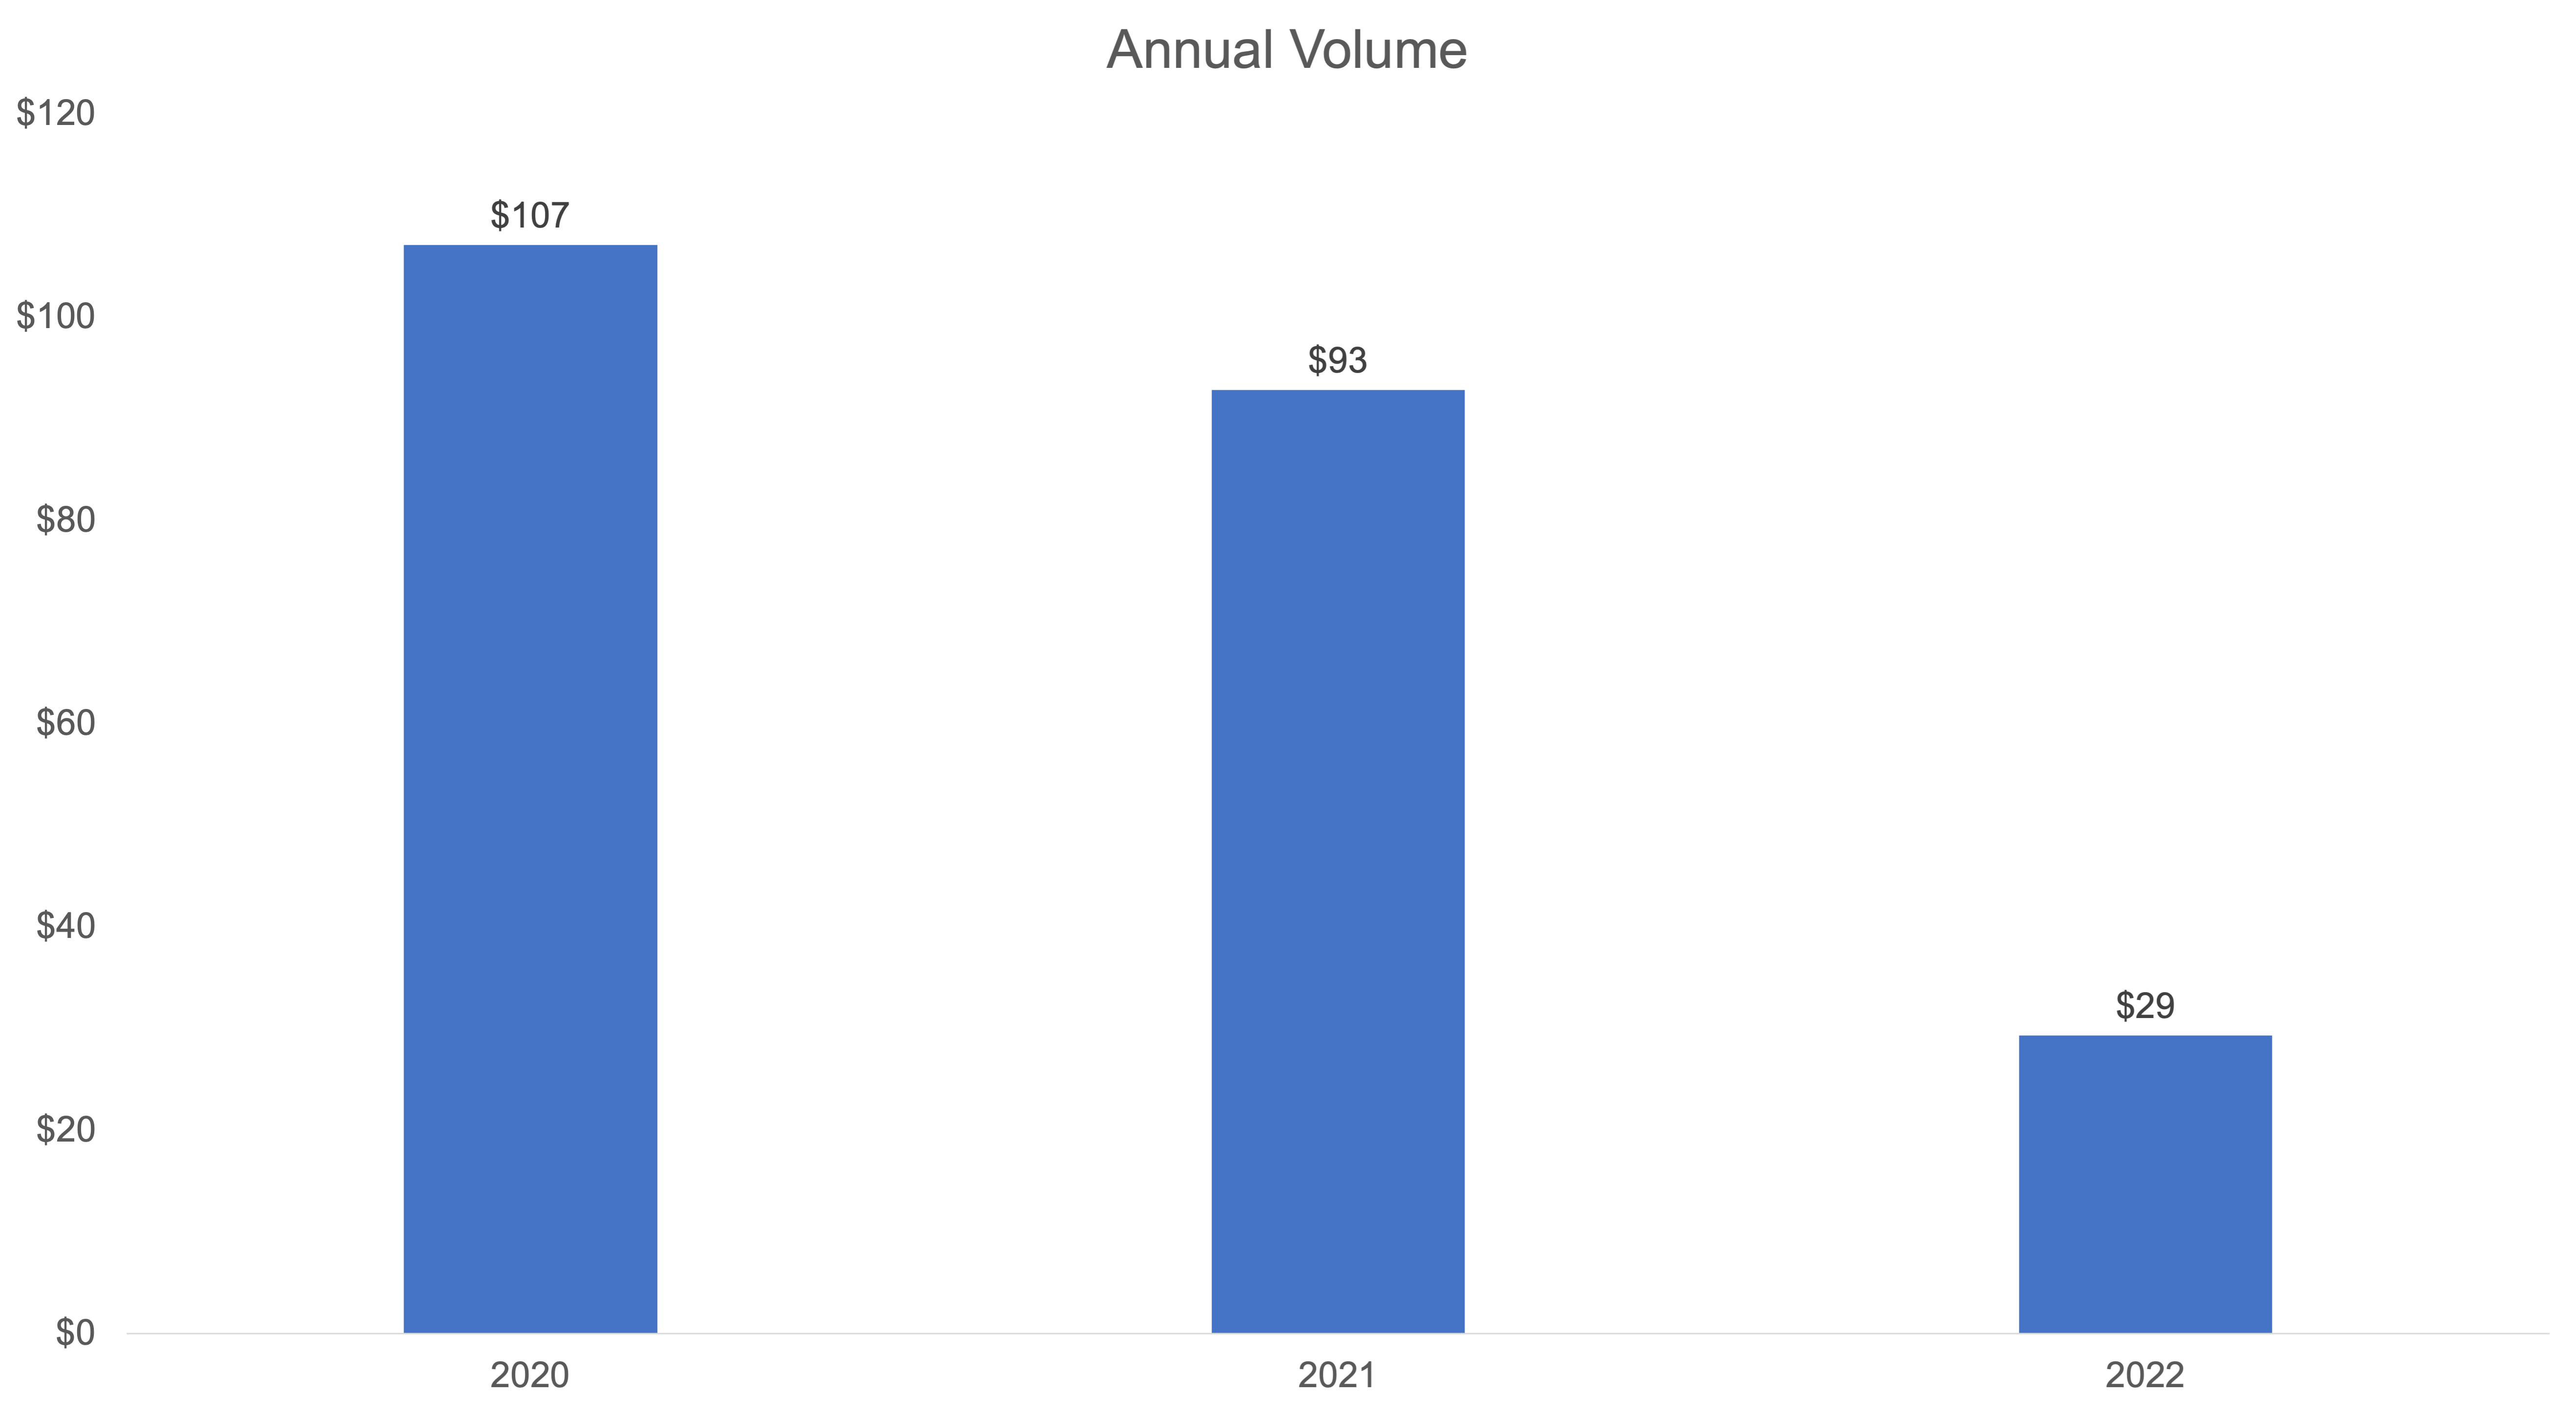
- Although Q3 and Q4 were relatively active (with ~$10 billion of issuance each quarter), 2022 total volume (~$29 billion) was the lowest over the last 10 years
- Technology issuers represented a lower percentage of total volume given the selloff in tech over the course of 2022
- Rising interest rates resulted in higher coupons / lower conversion premiums relative to 2020 and 2021 (~3.25% average coupon / ~29% average conversion premium); however, the relative attractiveness of convertible coupons compared to straight debt is now much higher
- The convertible market “normalized” in Q4 with new issue concessions below the 2022 average
- New Issuance. Q4 2022 saw 20 new issue convertible deals (18 debt & 2 mandatories) with a total volume of $9.2 billion, which brought total 2022 issuance to $29.3 billion across 56 deals. After two of the three busiest years on record (2020 & 2021), 2022 marked the lowest volume year in the last 10 years. The 20 deals in Q4 was the highest deal count for a quarter in 2022 and only trailed Q3, with $10.7 billion issued, in terms of volume. Average deal size was $459mm, which was less than the $559mm average through the first three quarters this year.
- Issuers came from a steady mix of sectors. Healthcare and Technology led the pack with five and four deals with volumes of $1.3 billion and $2.8 billion, respectively, followed by two deals each from Consumer Cyclical, Consumer Defensive, Financials, and Industrials worth $1.7bn, $565mm, $430mm, and $1.1 billion.
- Let’s now look at the two busiest sectors in a bit more detail. Given the sell off in Technology stocks, the sector comprised a much lower percentage of deal count and volume compared to last year and historical norms. For 2022, there were 14 Technology deals (25% of total) worth $8.3 billion (28% of volume). In 2021, the sector accounted for 44% and 52%. Healthcare, historically the second busiest sector, was responsible for 16 deals (29%) for $7.3 billion (25%), an increase from its proportions of 13% deals / 9% proceeds in 2021.
- Terms. As the 5-year UST yield continued to rise throughout Q4 it is no surprise that convertible terms widened as well. Even though terms may seem comparable to Q2 when the 5-year UST yield was lower at 2.95%, the average deal size and market cap for issuers were significantly smaller during Q2. Given that smaller (sub-$1 billion market cap) issuers tend to get worse terms, this most likely caused the discrepancy.
Average New Issue Coupon Rate and Conversion Premium 2020-2022
| Sector | 2020 | H1 2021 | H2 2021 | Q1 2022 | Q2 2022 | Q3 2022 | Q4 2022 | 2022 |
|---|---|---|---|---|---|---|---|---|
|
All Deals Average |
2.06% / 33% |
0.97% / 39% |
1.20% / 37% |
2.02% / 35% |
3.75% / 27% |
3.26% / 28% |
3.72% / 28% |
3.25% / 29% |
|
Tech Sector Average |
1.34% / 36% |
0.31% / 44% |
0.51% / 40% |
0.88% / 39% |
3.75% / 28% |
3.16% / 30% |
2.66% / 31% |
2.53% / 32% |
|
Healthcare Sector Average |
2.45% / 29% |
1.36% / 35% |
2.28% / 31% |
2.21% / 38% |
2.67% / 29% |
2.45% / 29% |
3.84% / 30% |
2.82% / 31% |
|
Average 5y UST |
0.53% |
0.73% |
0.99% |
1.83% |
2.95% |
3.23% |
4.00% |
3.01% |
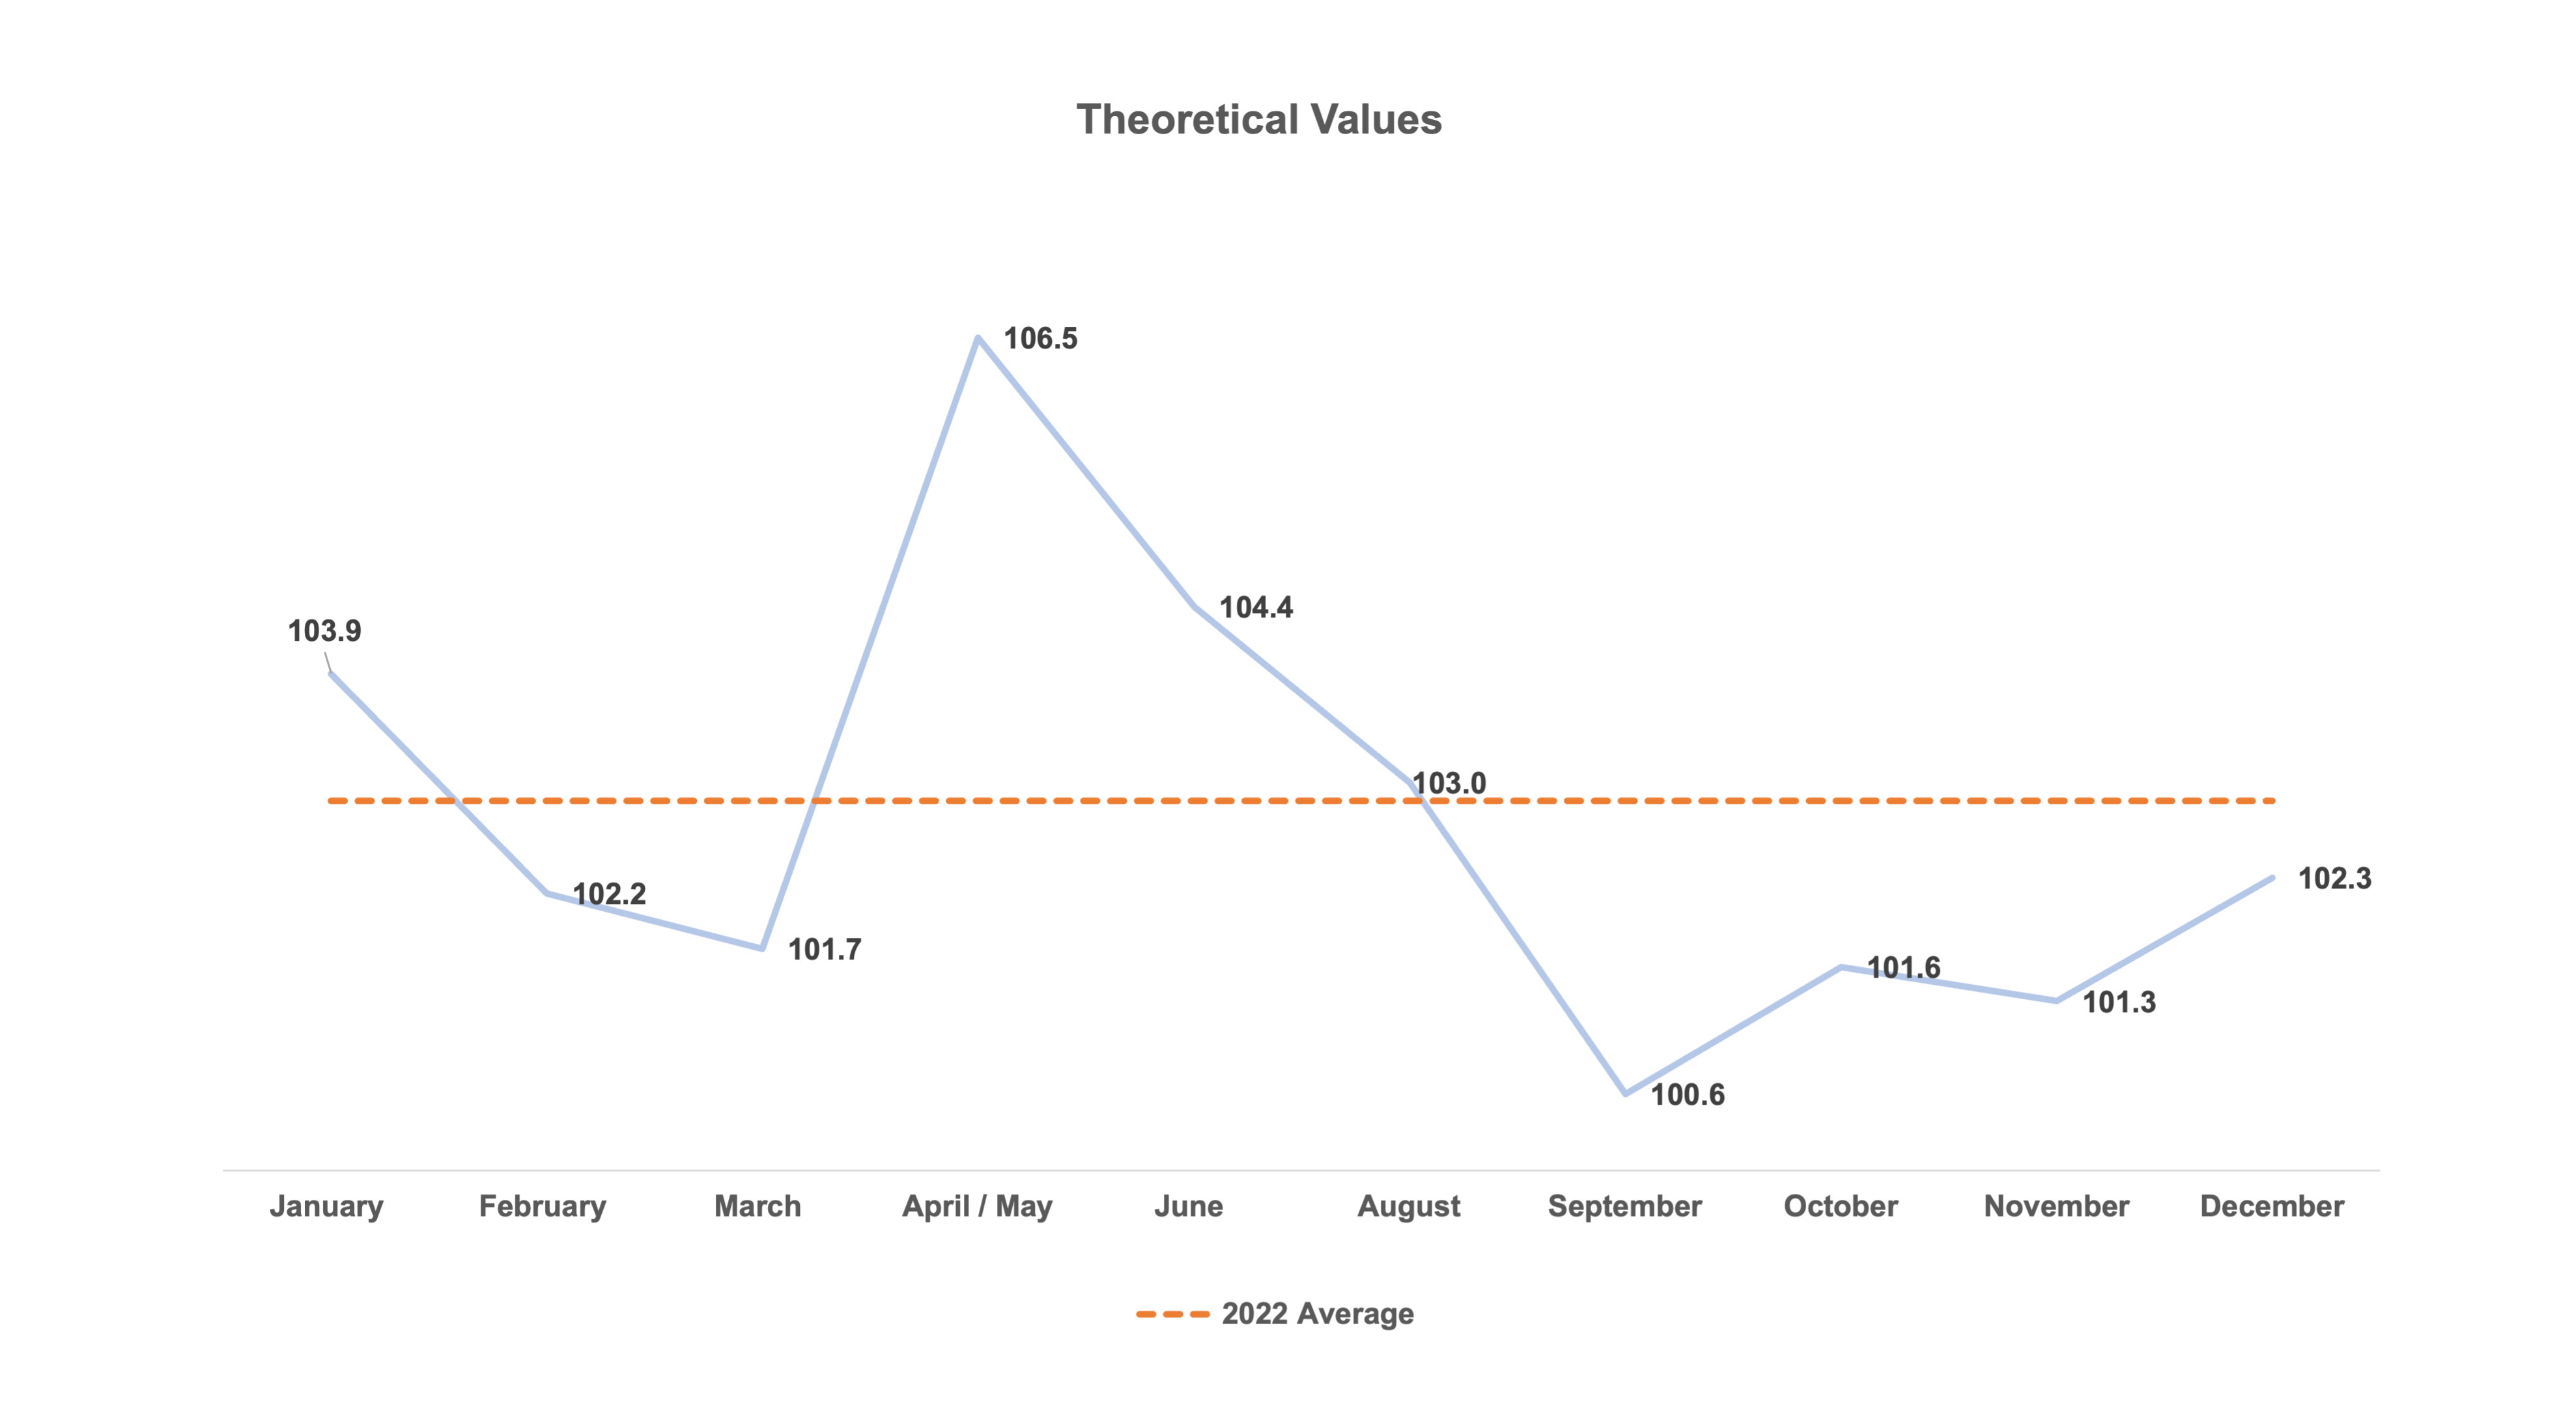
- Pricing Results: Theoretical Value. The graph below shows how much cheapness deals priced with throughout 2022. The Q4 average was 102.0, slightly below the 2022 average of 102.9, and more in-line with the typical long run average of 102-102.5. Looking at this chart and the previous table, it may be reasonable to conclude that even though terms were wider in Q4 than terms in previous quarters, when taking into account rates and the broader macro environment, deals actually priced more aggressively.
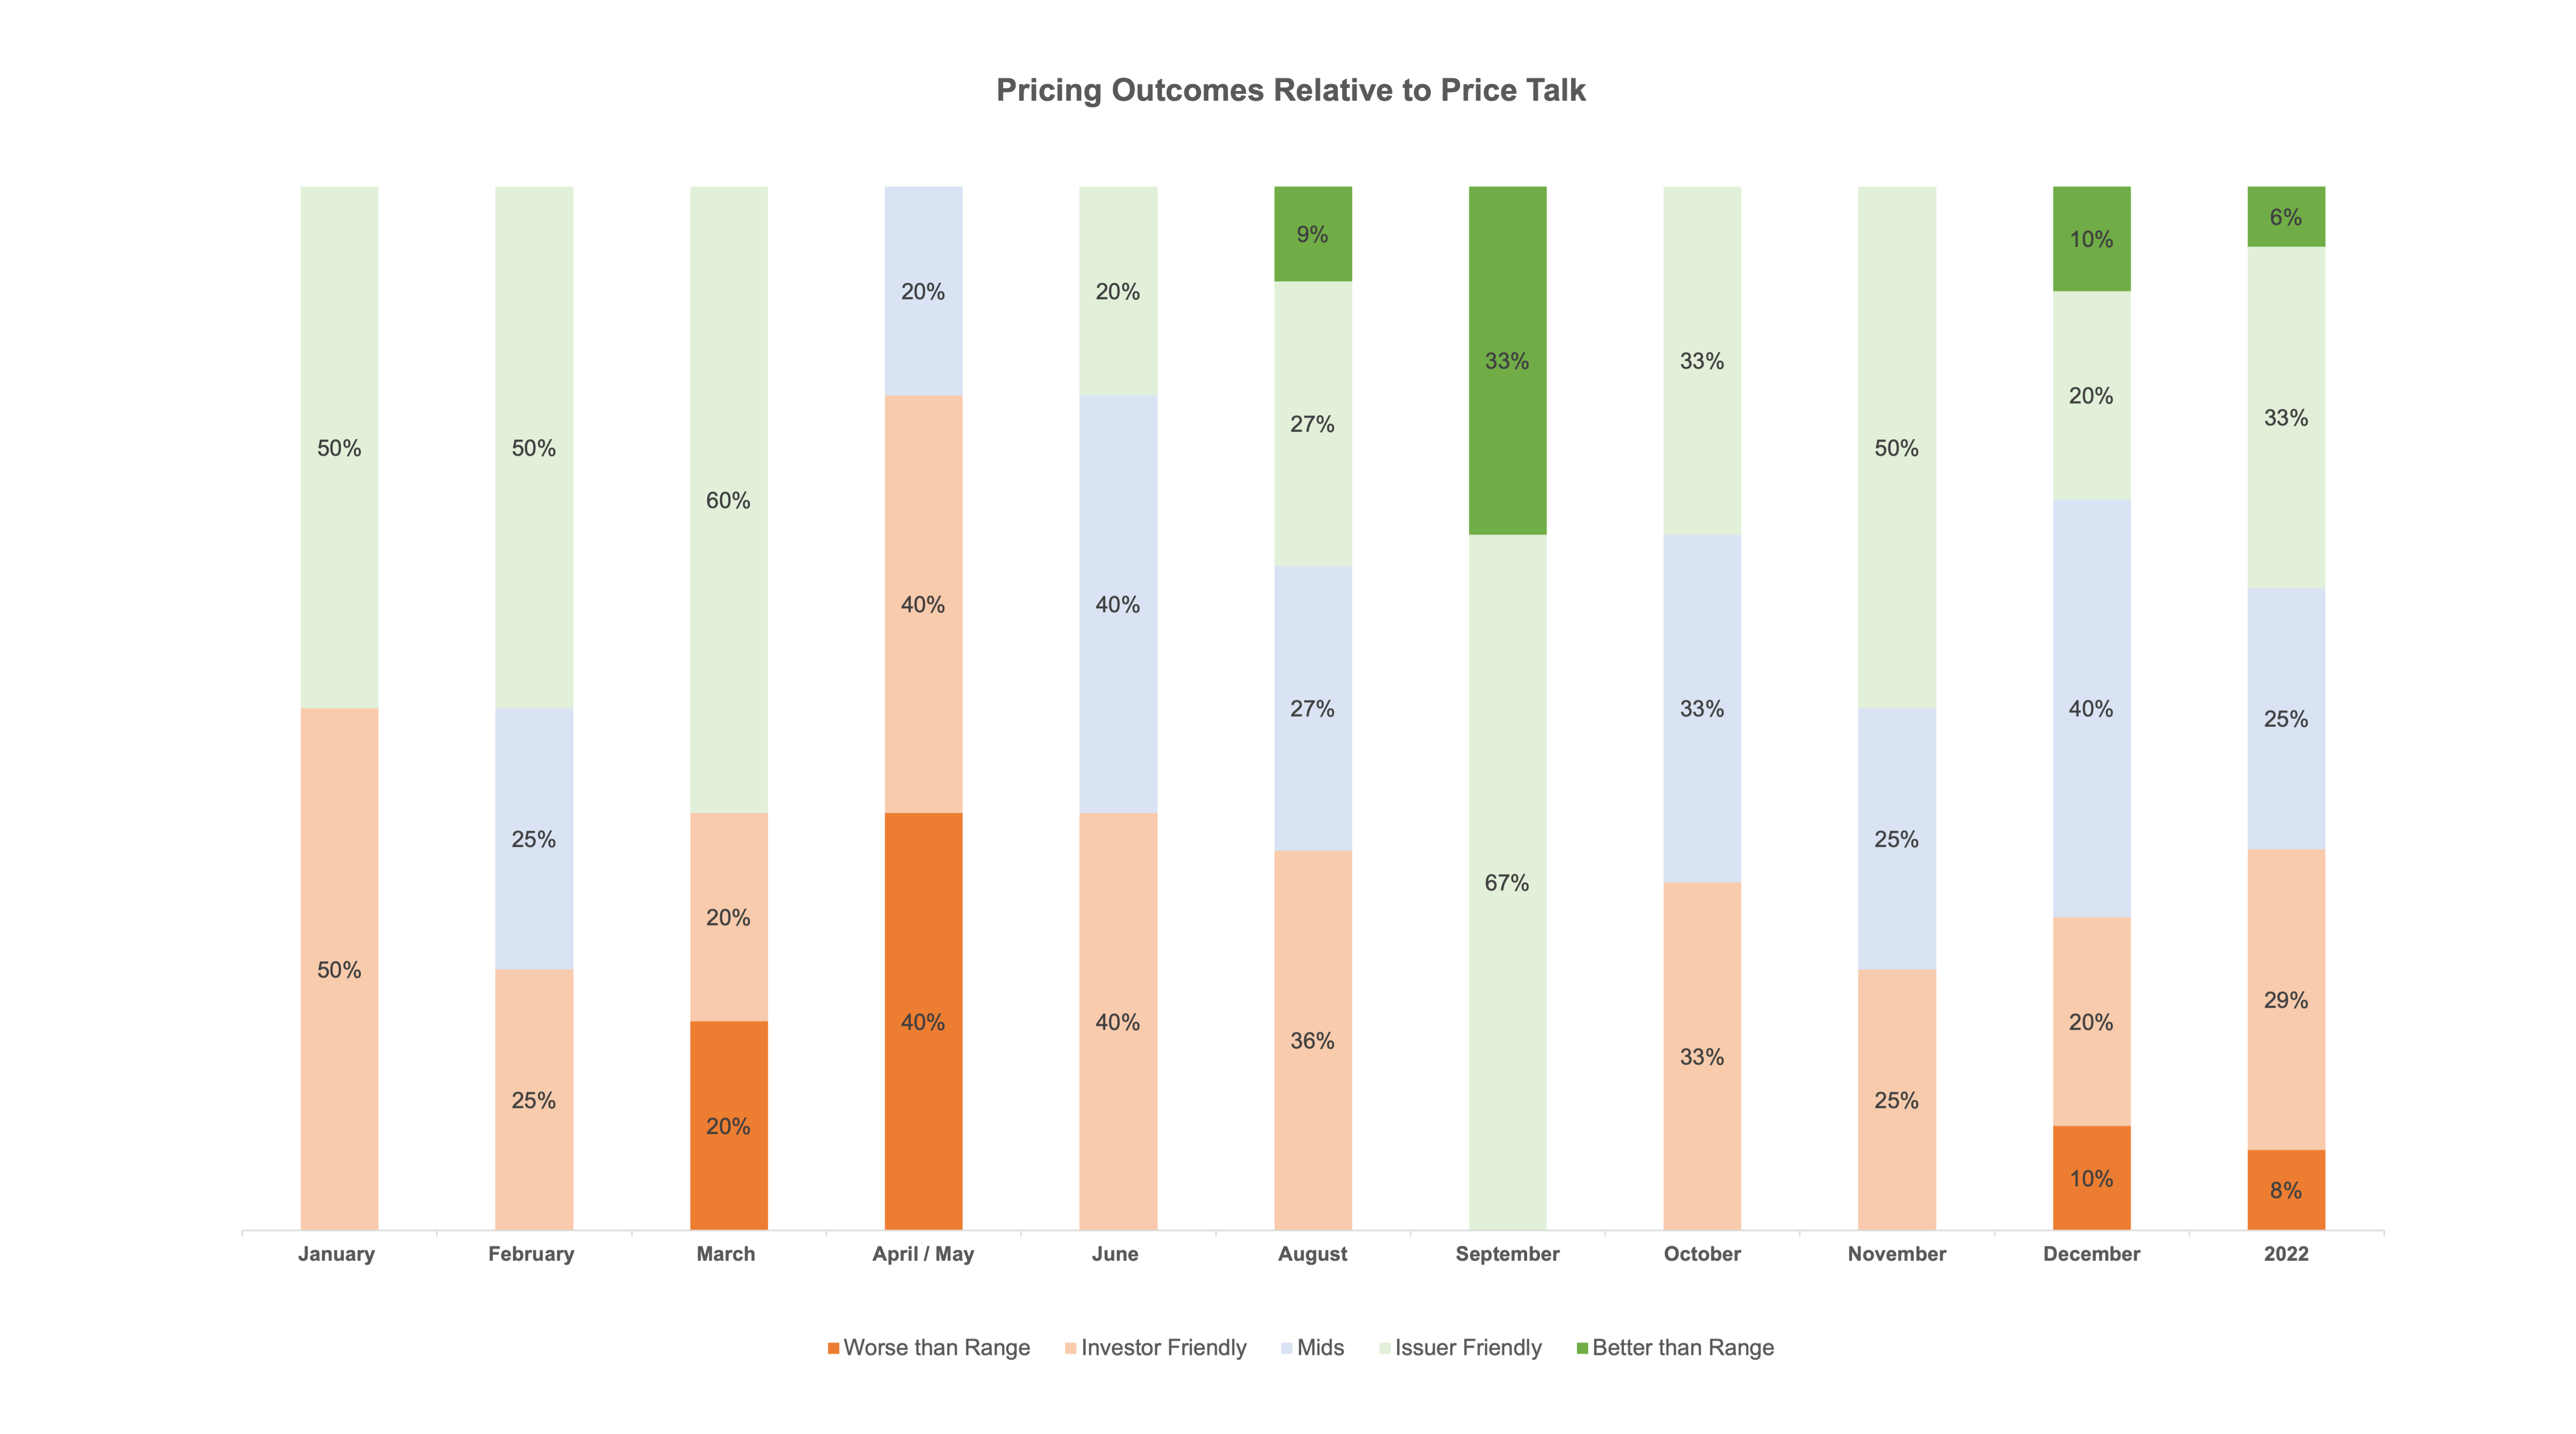
- Pricing Results vs. Price Talk. Per the below, pricing outcomes were balanced across the marketing range throughout Q4. Unlike some periods where marketing ranges appeared to be not so aggressive (the few deals in September) or overaggressive (April / May, when the market first started to sell off relative to Q1), Q4 was relatively balanced, with pricing in line with bank / issuer expectations.
- Day 1 Trading. On average for the quarter, deals traded up 1.4 points on a stock-price adjusted basis on the first day of trading compared to a 1.6 point average for the first three quarters of 2022 and 1.8 point average for 2021. The smaller new issue concession is a good indication that investors are willing to bid more aggressively on new issue offerings and may be sitting with cash to deploy.
Personal Views: The views expressed in this report reflect our personal views. This blog post is based on current public information that we consider reliable, but we do not represent it is accurate or complete, and it should not be relied on as such. The information, opinions, estimates and forecasts contained herein are as of the date hereof and are subject to change without prior notification. The large majority of reports by us are published at irregular intervals as appropriate in our judgment and ability to produce, so updates may not be made or available even when circumstances may have changed.
No Offer: This analysis is not an offer to sell or the solicitation of an offer to buy any security in any jurisdiction where such an offer or solicitation would be illegal. It does not constitute a personal recommendation or take into account the particular investment objectives, financial situations, or needs of individual clients. You must make an independent decision regarding investments or strategies mentioned on this website. Before acting on information on this website, you should consider whether it is suitable for your particular circumstances. You should not construe any of the material contained herein as business, financial, investment, hedging, trading, legal, regulatory, tax, or accounting advice. The price and value of investments referred to in this analysis and the income from them may fluctuate. Past performance is not a guide to future performance, future returns are not guaranteed, and a loss of original capital may occur.