
As part of our market update series, please see the summary below of what we saw in the convertible market in the third quarter of 2023 along with some key takeaways.
- Q3 volume of $14.7 billion slightly surpassed Q2 volume of $14.3 billion, and now puts 2023 on pace for ~$56 billion of issuance (~$42bn YTD)
- Higher risk-free rates and tighter credit spreads have largely canceled each other out as convertible terms remain largely unchanged from Q2
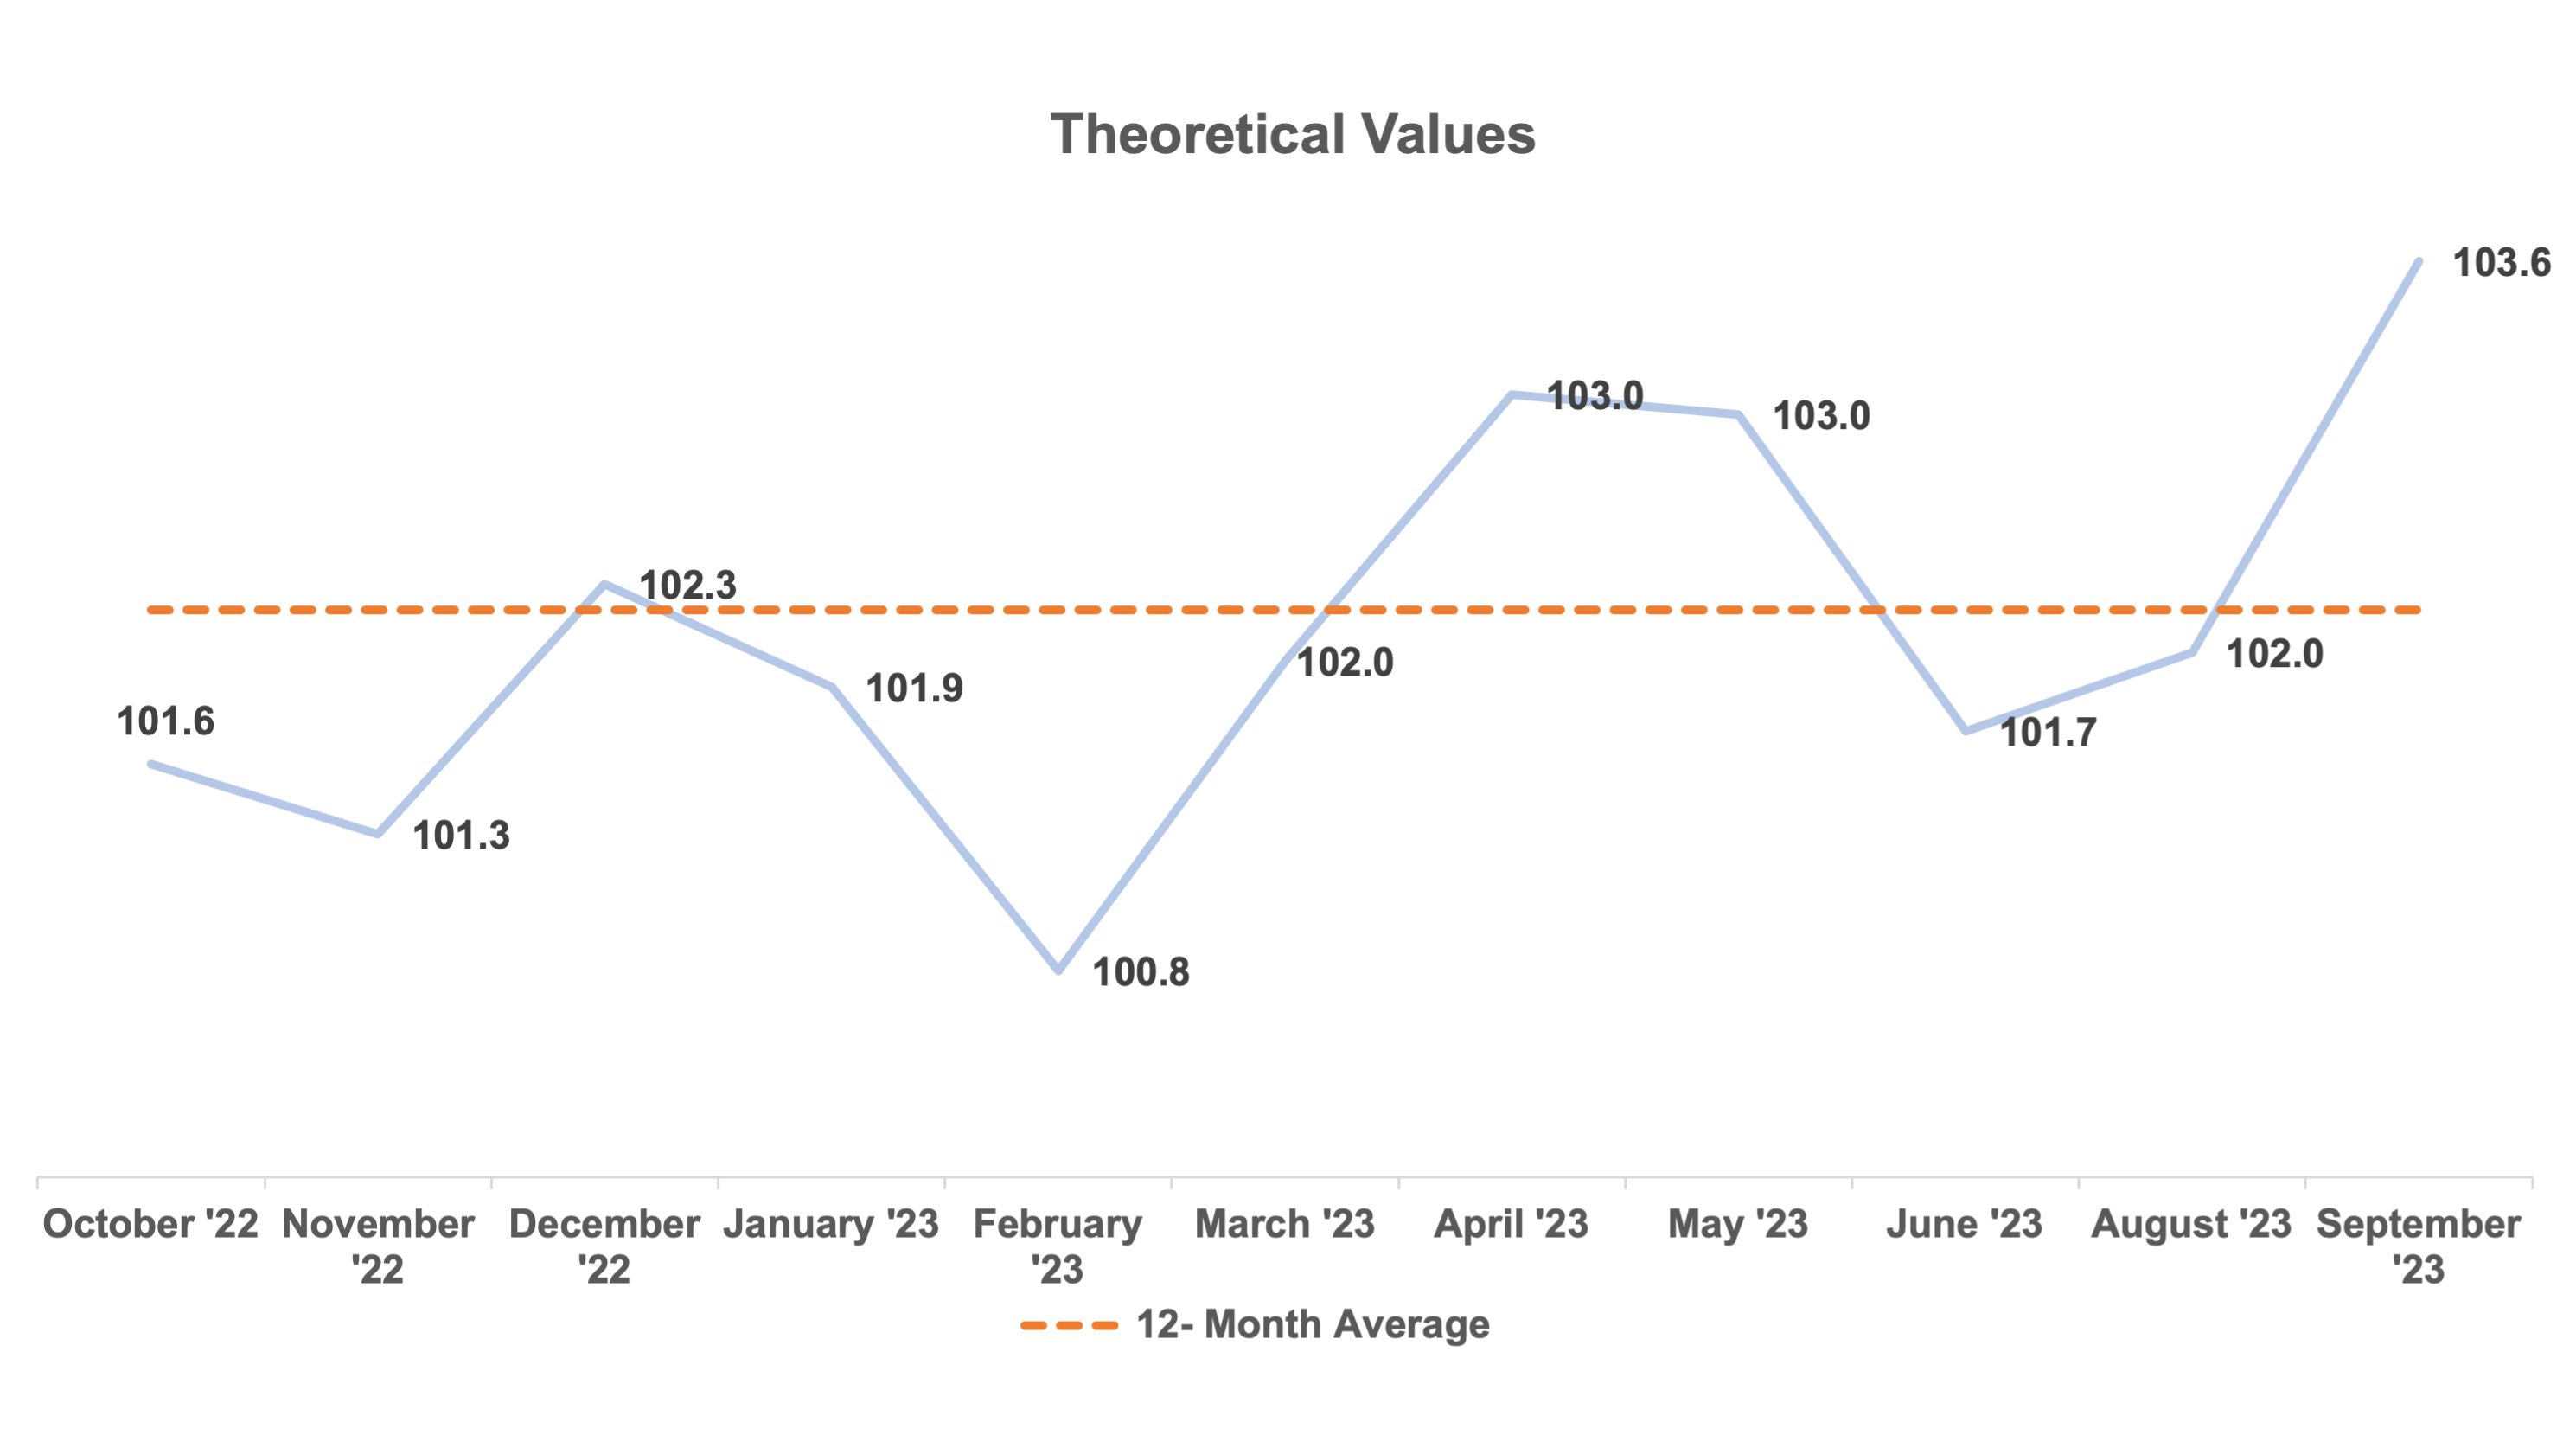
- Theoretical values for deals widened in September, potentially reflecting the broader market selloff throughout the month and lower new issue concession investors earned throughout the quarter
New Issuance. Q3 2023 saw 23 new convertible deals (22 debt & 1 mandatory) with a total volume of $14.7 billion, which is slightly greater than the $14.3 billion issued in Q2. Major stock market indices fell slightly, with the S&P 500 and NASDAQ Composite retreating 3.6% and 4.1%, respectively, with the entire sell-off occurring in September. The indices now stand +11.7% and +26.3% YTD. Deal size in Q3 continued to raise up the historical average at ~$640 million for the quarter.
The below chart shows the breakdown of deal count and volume from each sector during the quarter. While Q3 continued to see a diversified issuer base (four sectors contributing three deals each), Technology and Industrials accounted for more than half the number of deals and volume. The Utilities sector, which had been the surprise story during the first half of the year (seven deals for $8.4 billion) only saw one deal for $1 billion in Q3.
| Sector | Deal Count | Deal Count % | Volume ($bn) | Volume % |
|---|---|---|---|---|
|
Technology |
7 |
30.4% |
6.1 |
41.5% |
|
Industrials |
5 |
21.7% |
2.4 |
16.3% |
|
Healthcare |
3 |
13.0% |
1.6 |
10.9% |
|
Consumer |
3 |
13.0% |
1.3 |
8.8% |
|
Real Estate |
2 |
8.7% |
0.7 |
4.8% |
|
Financials |
1 |
4.3% |
1.4 |
9.5% |
|
Utilities |
1 |
4.3% |
1.0 |
6.8% |
|
Basic Materials |
1 |
4.3% |
0.2 |
1.4% |
|
Total |
23 |
100% |
14.7 |
100% |
Terms. Convertible terms remained relatively unchanged from Q2 even though the average 5-year US Treasury yield for the quarter increased 0.62%. After removing the Utilities deals from the first half of 2023, which tend to have higher coupons and lower conversion premiums due to higher dividend yields and lower volatility profiles, there was not a material difference in terms even with the elevated 5-year US Treasury yield. The main reason appears to be tightening credit spreads. The average spread for the ‘B’ index during Q2 2023 was 480 bps, but decreased to 406 bps in Q3. Greater issuance from the technology sector in Q3 also had a positive impact on aggregate average terms.
Average New Issue Coupon Rate and Conversion Premium 2022-2023 YTD
| Sector | H1 2022 | H2 2022 | Q1 2023 | Q2 2023 | Q3 2023 |
|---|---|---|---|---|---|
|
All Deals |
2.85% / 31% |
3.52% / 28% |
3.76% / 30% |
3.33% / 26% |
2.96% / 30% |
|
Technology |
2.02% / 33% |
2.91% / 31% |
3.14% / 30% |
1.96% / 28% |
2.23% / 28% |
|
Healthcare |
2.44% / 33% |
3.07% / 29% |
2.33% / 29% |
2.97% / 28% |
1.58% / 33% |
|
Average 5y UST |
2.39% |
3.61% |
3.81% |
3.70% |
4.32% |
Pricing Results: Theoretical Value. The average theoretical value for Q3 was 102.8, with greater cheapness occurring throughout September, which is in-line with the equity market selloff. The trailing 12-month average now stands at 102.2.
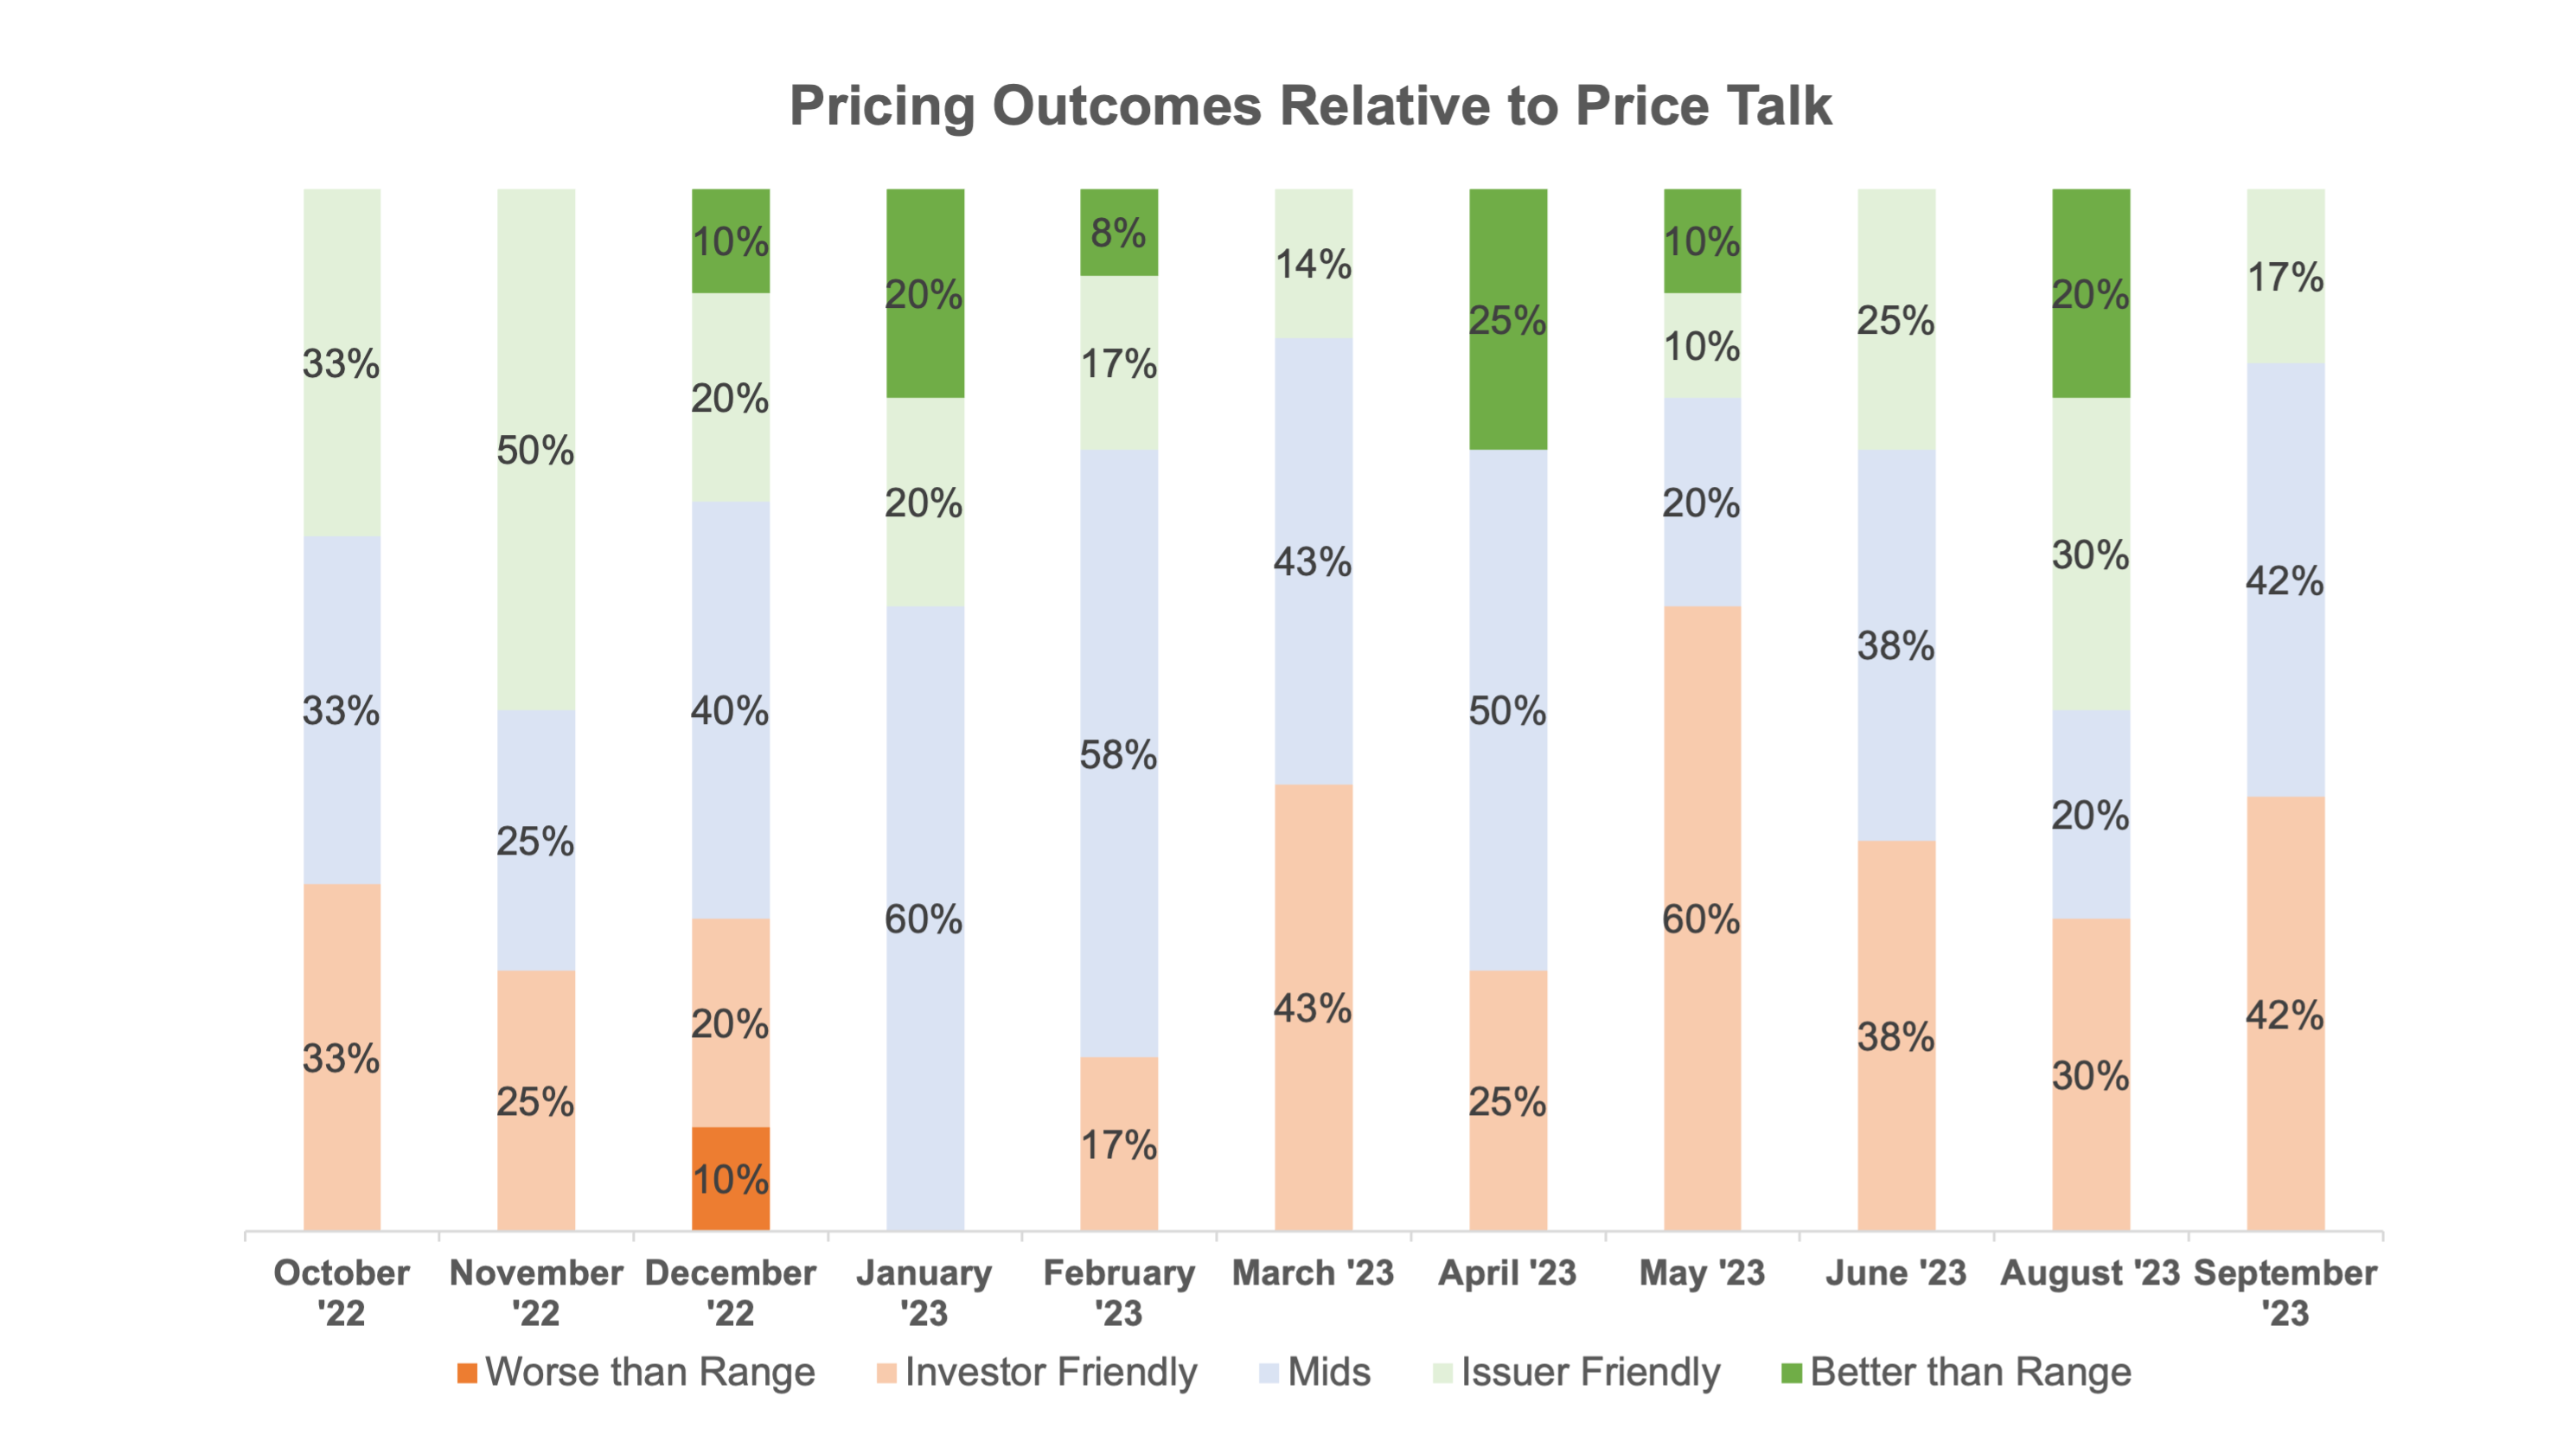
Pricing Results vs. Price Talk. As can be seen in greater detail below, pricing seemed to be relatively balanced during Q3, although less favorable for issuers in September.
Day 1 Trading. On average, deals traded up 0.7 points on a stock-price adjusted basis on the first day of trading in Q3 2023 compared to a 1.3 point average going back to the beginning of 2022. While less new issue concessions are beneficial for issuers, if investors are not earning enough on new deals, they may begin to push back on terms and cheapness. As seen in our Theoretical Values chart above, September deals priced to 103.6 on average, which may be the beginning of this theme playing out.
Personal Views: The views expressed in this report reflect our personal views. This blog post is based on current public information that we consider reliable, but we do not represent it is accurate or complete, and it should not be relied on as such. The information, opinions, estimates and forecasts contained herein are as of the date hereof and are subject to change without prior notification. The large majority of reports by us are published at irregular intervals as appropriate in our judgment and ability to produce, so updates may not be made or available even when circumstances may have changed.
No Offer: This analysis is not an offer to sell or the solicitation of an offer to buy any security in any jurisdiction where such an offer or solicitation would be illegal. It does not constitute a personal recommendation or take into account the particular investment objectives, financial situations, or needs of individual clients. You must make an independent decision regarding investments or strategies mentioned on this website. Before acting on information on this website, you should consider whether it is suitable for your particular circumstances. You should not construe any of the material contained herein as business, financial, investment, hedging, trading, legal, regulatory, tax, or accounting advice. The price and value of investments referred to in this analysis and the income from them may fluctuate. Past performance is not a guide to future performance, future returns are not guaranteed, and a loss of original capital may occur.