
As part of our market update series, please see the summary below of what we saw in the convertible market in Q3 2022. Notably,
- Q3 volumes were the highest of the year totaling $10.5bn – accounts for over 50% of the YTD volumes
- Healthcare issuance continues to be the largest driver of volumes with technology coming in second
- Average terms were more favorable in Q3 than in Q2, which is largely due to the improved sentiment in the market; however, the market softened post the CPI print (in the beginning of September) and primary issuance cooled
- Issuers took advantage of improved sentiment as most deals priced with “normalized cheapness” and terms were at the issuer friendly end of the range (or better)
- New Issuance. The convertible market saw a bump in activity in Q3, with 15 deals (14 debt & 1 mandatory) worth $10.5bn. All deals came within a 6.5-week window (8/1 – 9/14) after equities rallied off their June lows, but before they revisited these lows during the second half of September. Q3 accounts for 53% of the 2022 volume YTD, highlighting the overall slowdown in new issuance this year.
Healthcare was the most frequent sector to tap the market, accounting for 5 deals worth $3.2bn (4 of which were biotech). Technology followed with 4 deals worth $1.7bn, including one transaction that was done as an exchange. Other notable sectors for the quarter include Real Estate, Utilities, Consumer, and Industrials.
- Terms. While the average 5y UST yield for Q3 was higher than that in Q2, we’ll note that the rate did fall from its peak of 3.60% on 6/14 to 2.67% on 8/1 before climbing to 4.21% on 9/27. This temporary decrease in rates coupled with the rally in equities led to improved convertible terms for the quarter compared to Q2. With the rally ending in the second half of September, and as equities and bonds found new lows due to Fed expectations, we may see terms continue to widen in Q4.
Average New Issue Coupon Rate and Conversion Premium 2019-2022 YTD
| Sector | 2019 | 2020 | H1 2021 | H2 2021 | Q1 2022 | Q2 2022 | Q3 2022 |
|---|---|---|---|---|---|---|---|
|
All Deals Average |
2.20% / 30% |
2.06% / 33% |
0.97% / 39% |
1.20% / 37% |
2.02% / 35% |
3.75% / 27% |
3.26% / 28% |
|
Tech Sector Average |
1.30% / 34% |
1.34% / 36% |
0.31% / 44% |
0.51% / 40% |
0.88% / 39% |
3.75% / 28% |
3.16% / 30% |
|
Healthcare Sector Average |
2.59% / 29% |
2.45% / 29% |
1.36% / 35% |
2.28% / 31% |
2.21% / 38% |
2.67% / 29% |
2.45% / 29% |
|
Average 5y UST |
1.95% |
0.53% |
0.73% |
0.99% |
1.83% |
2.95% |
3.23% |
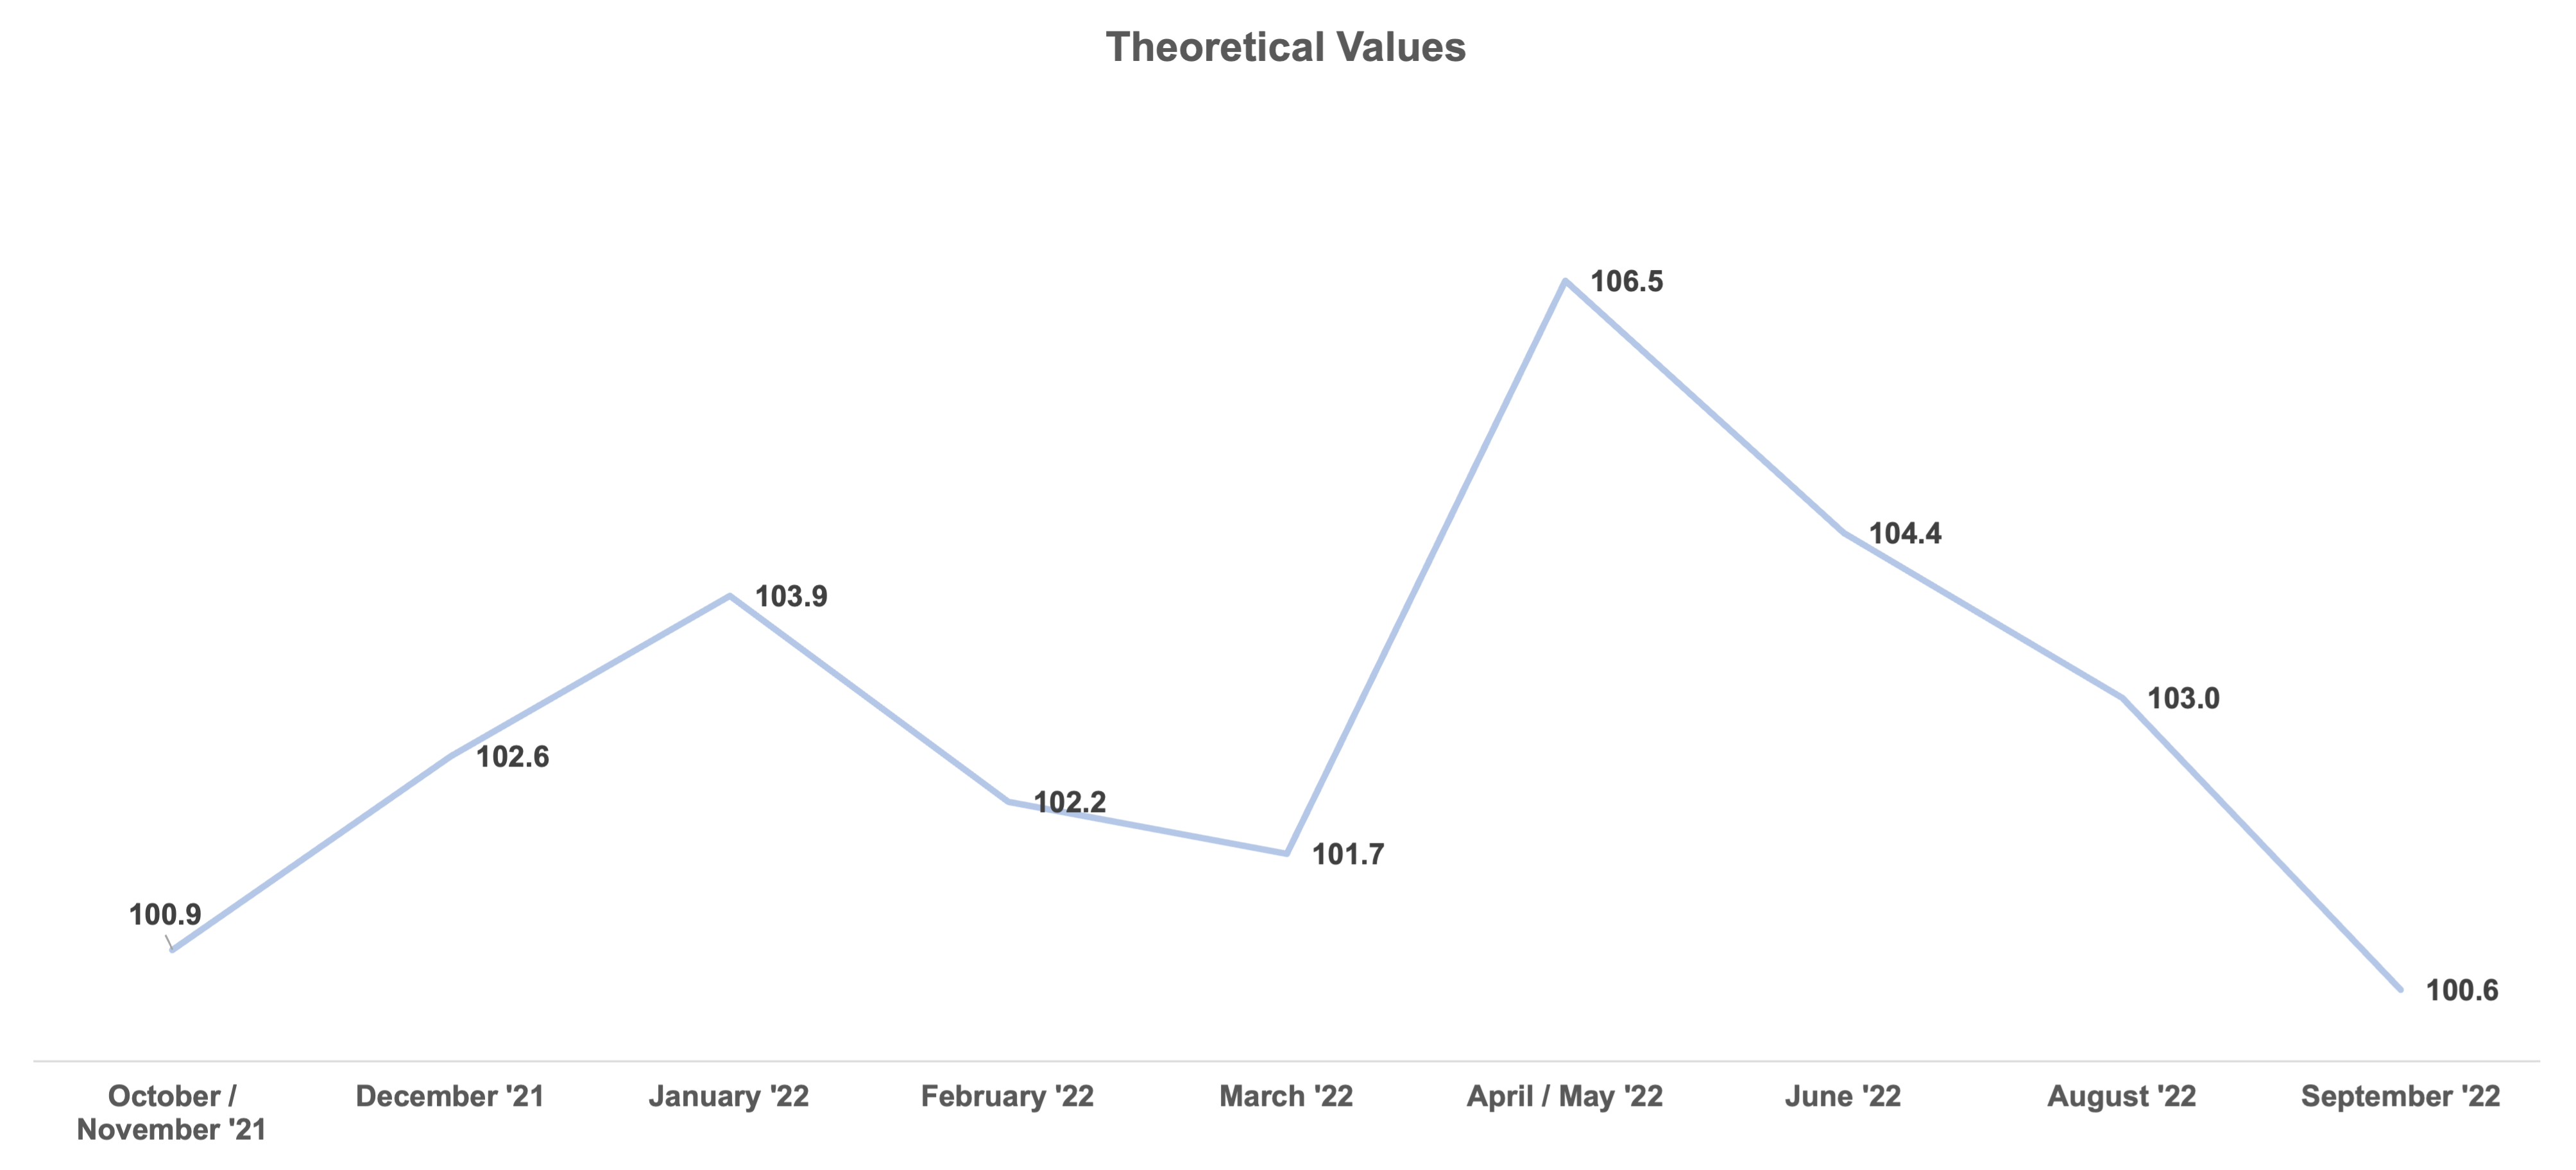
- Pricing Results: Theoretical Value. The graph below shows how much cheapness deals were ultimately priced with over the last 12 months. The Q3 average was 102.4, with a low point coming in September (though this average is based on a relatively small sample size with only 3 deals and all deals coming from large market cap issuers). The downward trend points to improved investor sentiment during the Q3 market issuance window as issuers were able to price deals with less of a new issue concession; although may also reflect more conservative credit / volatility assumptions as underwriters and issuers acclimate to this year’s markets.
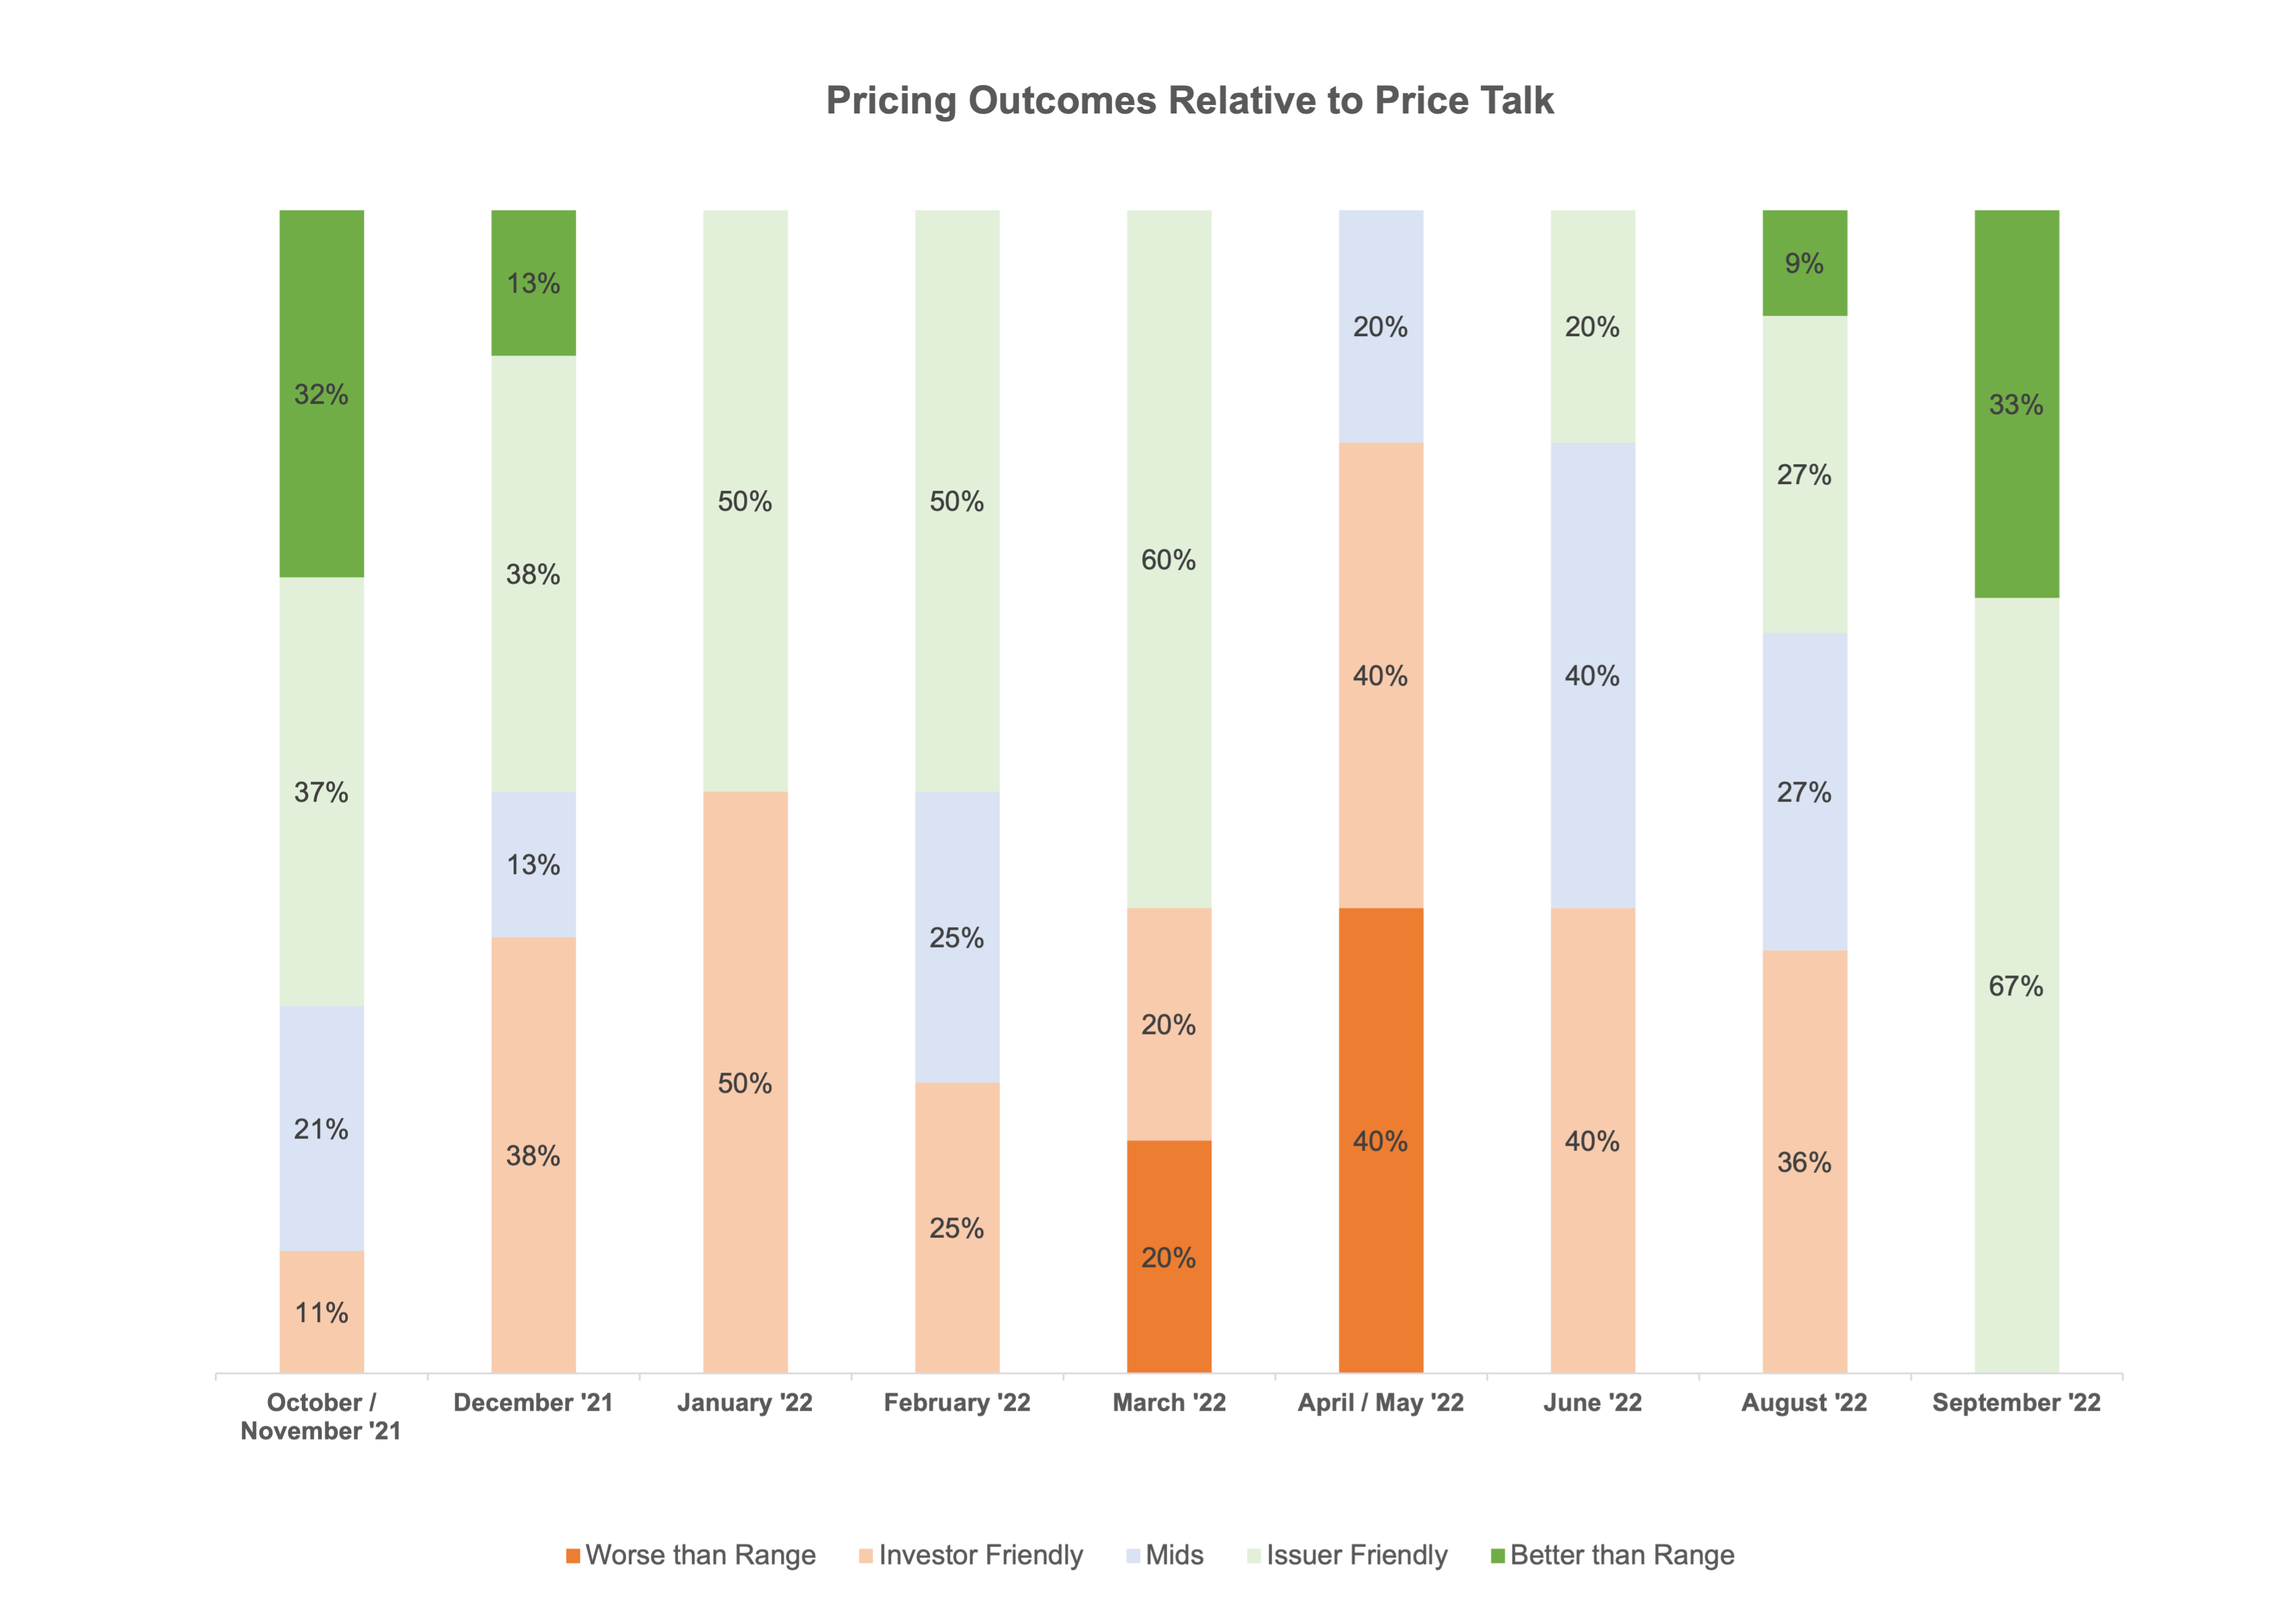
- Pricing Results vs. Price Talk. Per the below, deals priced about evenly across the marketing range during August, but priced only on the issuer friendly side in September. This is congruent with the previous theoretical value chart, which shows that the discount that investors warranted to participate in deals dropped.
- Day 1 Trading. On average for the quarter, deals traded up 2.6 points on a stock-price adjusted basis on the first day of trading compared to a 0.7 point average in Q2 and 1.8 point average for 2021. The greater “expansion” in the secondary market represents investors’ ability to sell these deals for more profit than what is typical during the first day of trading. This data point may also suggest that investors were more bullish than underwriters were, especially considering that they were paying for deals that had much less “Theoretical Value”.
Personal Views: The views expressed in this report reflect our personal views. This blog post is based on current public information that we consider reliable, but we do not represent it is accurate or complete, and it should not be relied on as such. The information, opinions, estimates and forecasts contained herein are as of the date hereof and are subject to change without prior notification. The large majority of reports by us are published at irregular intervals as appropriate in our judgment and ability to produce, so updates may not be made or available even when circumstances may have changed.
No Offer: This analysis is not an offer to sell or the solicitation of an offer to buy any security in any jurisdiction where such an offer or solicitation would be illegal. It does not constitute a personal recommendation or take into account the particular investment objectives, financial situations, or needs of individual clients. You must make an independent decision regarding investments or strategies mentioned on this website. Before acting on information on this website, you should consider whether it is suitable for your particular circumstances. You should not construe any of the material contained herein as business, financial, investment, hedging, trading, legal, regulatory, tax, or accounting advice. The price and value of investments referred to in this analysis and the income from them may fluctuate. Past performance is not a guide to future performance, future returns are not guaranteed, and a loss of original capital may occur.