
As part of our market update series, here are our key takeaways from the convertible market in the second quarter of 2024.
- There was $27 billion of new issuance in the quarter, putting 2024 on pace for ~$97 billion of total volume. The second quarter was the most active in the convertible market since the COVID-19 peak in 2021, when rates were at an all-time low.
- The convertible market continues to offer flexibility for issuers seeking to manage their capital structure and meet their financing needs. Two-thirds of issuers in Q2 used proceeds to refinance existing debt. Interestingly, a quarter of issuers raised funds to repurchase stock which is a major theme we haven’t seen since pre-COVID-19.
- Issuers representing nine unique sectors accessed the convertible market in Q2, with no sector contributing to more than one-third of the total deal count. This sector diversification underscores the opportunity for all issuers in the convertible market.
- Coupons for issuers in the technology and healthcare sectors are the lowest they have been since 2021.
- Q2 saw a return to the convertible market for US-listed Chinese ADRs, with 3 issuers collectively raising $8.5 billion in the quarter.
New Issuance: Q2 2024 saw 31 new issue deals (30 convertible notes and 1 mandatory security) with a total volume of $27.0 billion, the highest issuance volume for any quarter since Q1 2021. Major stock indices continued to rally, with the S&P 500 and NASDAQ Composite gaining 15.4% and 20.1% respectively year-to-date, with several convertible issuers raising funds near all-time highs. Average deal size in Q2 was ~$870 million, well above historical averages and largely driven by seven deals of $1 billion or greater executed in the quarter.
The below chart shows the breakdown of deal count and volume from each sector. The Technology and Internet Retail sector was the largest by volume, contributing to 48% of total issuance in the market.
| Sector | Volume ($bn) | Deal Count |
|---|---|---|
|
Technology / Internet Retail |
13.0 |
10 |
|
Utilities |
7.0 |
7 |
|
Consumer |
2.4 |
3 |
|
Communication Services |
1.8 |
3 |
|
Industrials |
1.0 |
3 |
|
Healthcare |
1.0 |
2 |
|
Consumer Defensive / Real Estate / Basic Materials |
0.74 |
1 each |
Terms: The average coupon rate in Q2 trended marginally wider than the prior quarter, driven in part by a 36 basis point. increase in the average 5-year US Treasury yield and a higher prevalence of issuers in high-dividend paying and low volatility sectors (e.g., Utilities). As a point of comparison, the coupons for issuers in the technology and healthcare sectors are the lowest they have been since 2021.
Average New Issue Coupon Rate and Conversion Premium 2021 – 2024 YTD
| Sector | 2021 | 2022 | 2023 | Q1 2024 | Q2 2024 |
|---|---|---|---|---|---|
|
All Deals |
1.42% / 37% |
3.45% / 29% |
3.50% / 30% |
2.50% / 31% |
3.06% / 31% |
|
Technology |
0.39% / 42% |
2.68% / 31% |
2.80% / 27% |
2.00% / 32% |
1.26% / 31% |
|
Healthcare |
1.59% / 34% |
3.08% / 30% |
2.56% / 30% |
2.35% / 32% |
2.31% / 31% |
|
Average 5y UST |
0.86% |
3.01% |
4.07% |
4.12% |
4.48% |
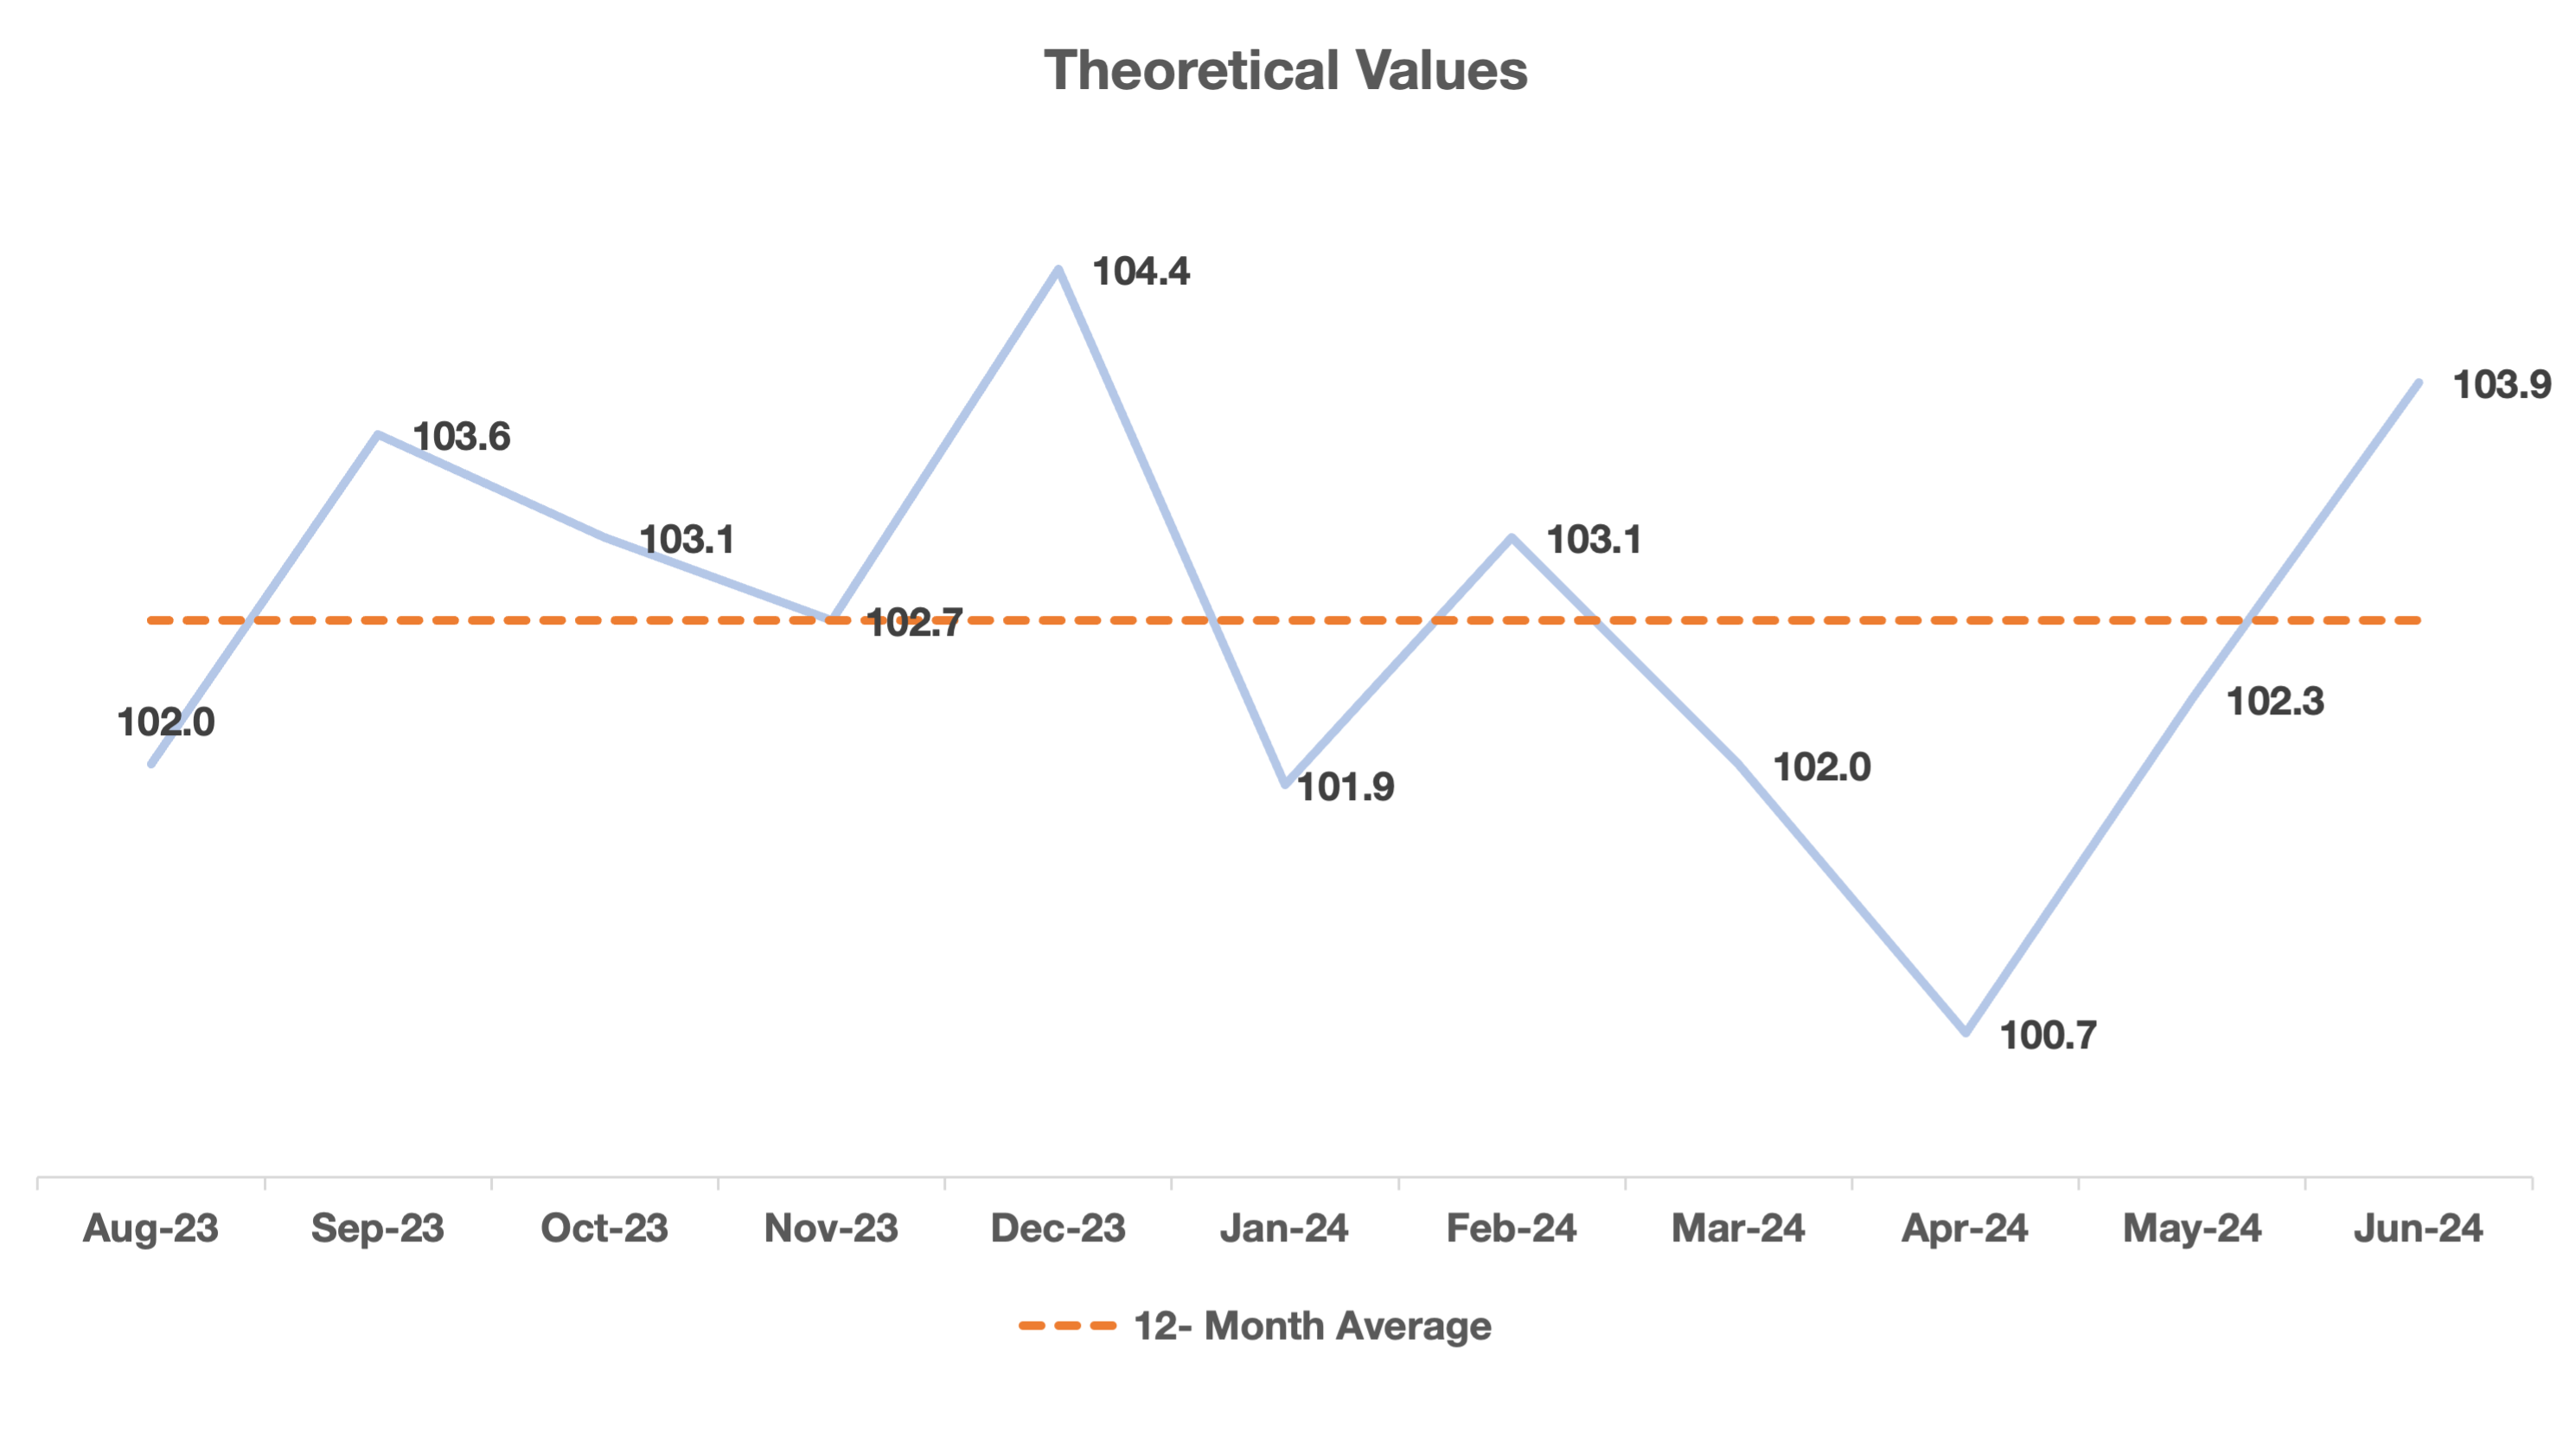
Pricing Results: Theoretical Value: The graph below shows how much cheapness was priced into deals over the past 12 months. The Q2 2024 average was 102.3, which is slightly below the last 12 months’ average of 102.7. Looking at this chart and the previous table, it is evident that deals were priced more conservatively as the quarter progressed.
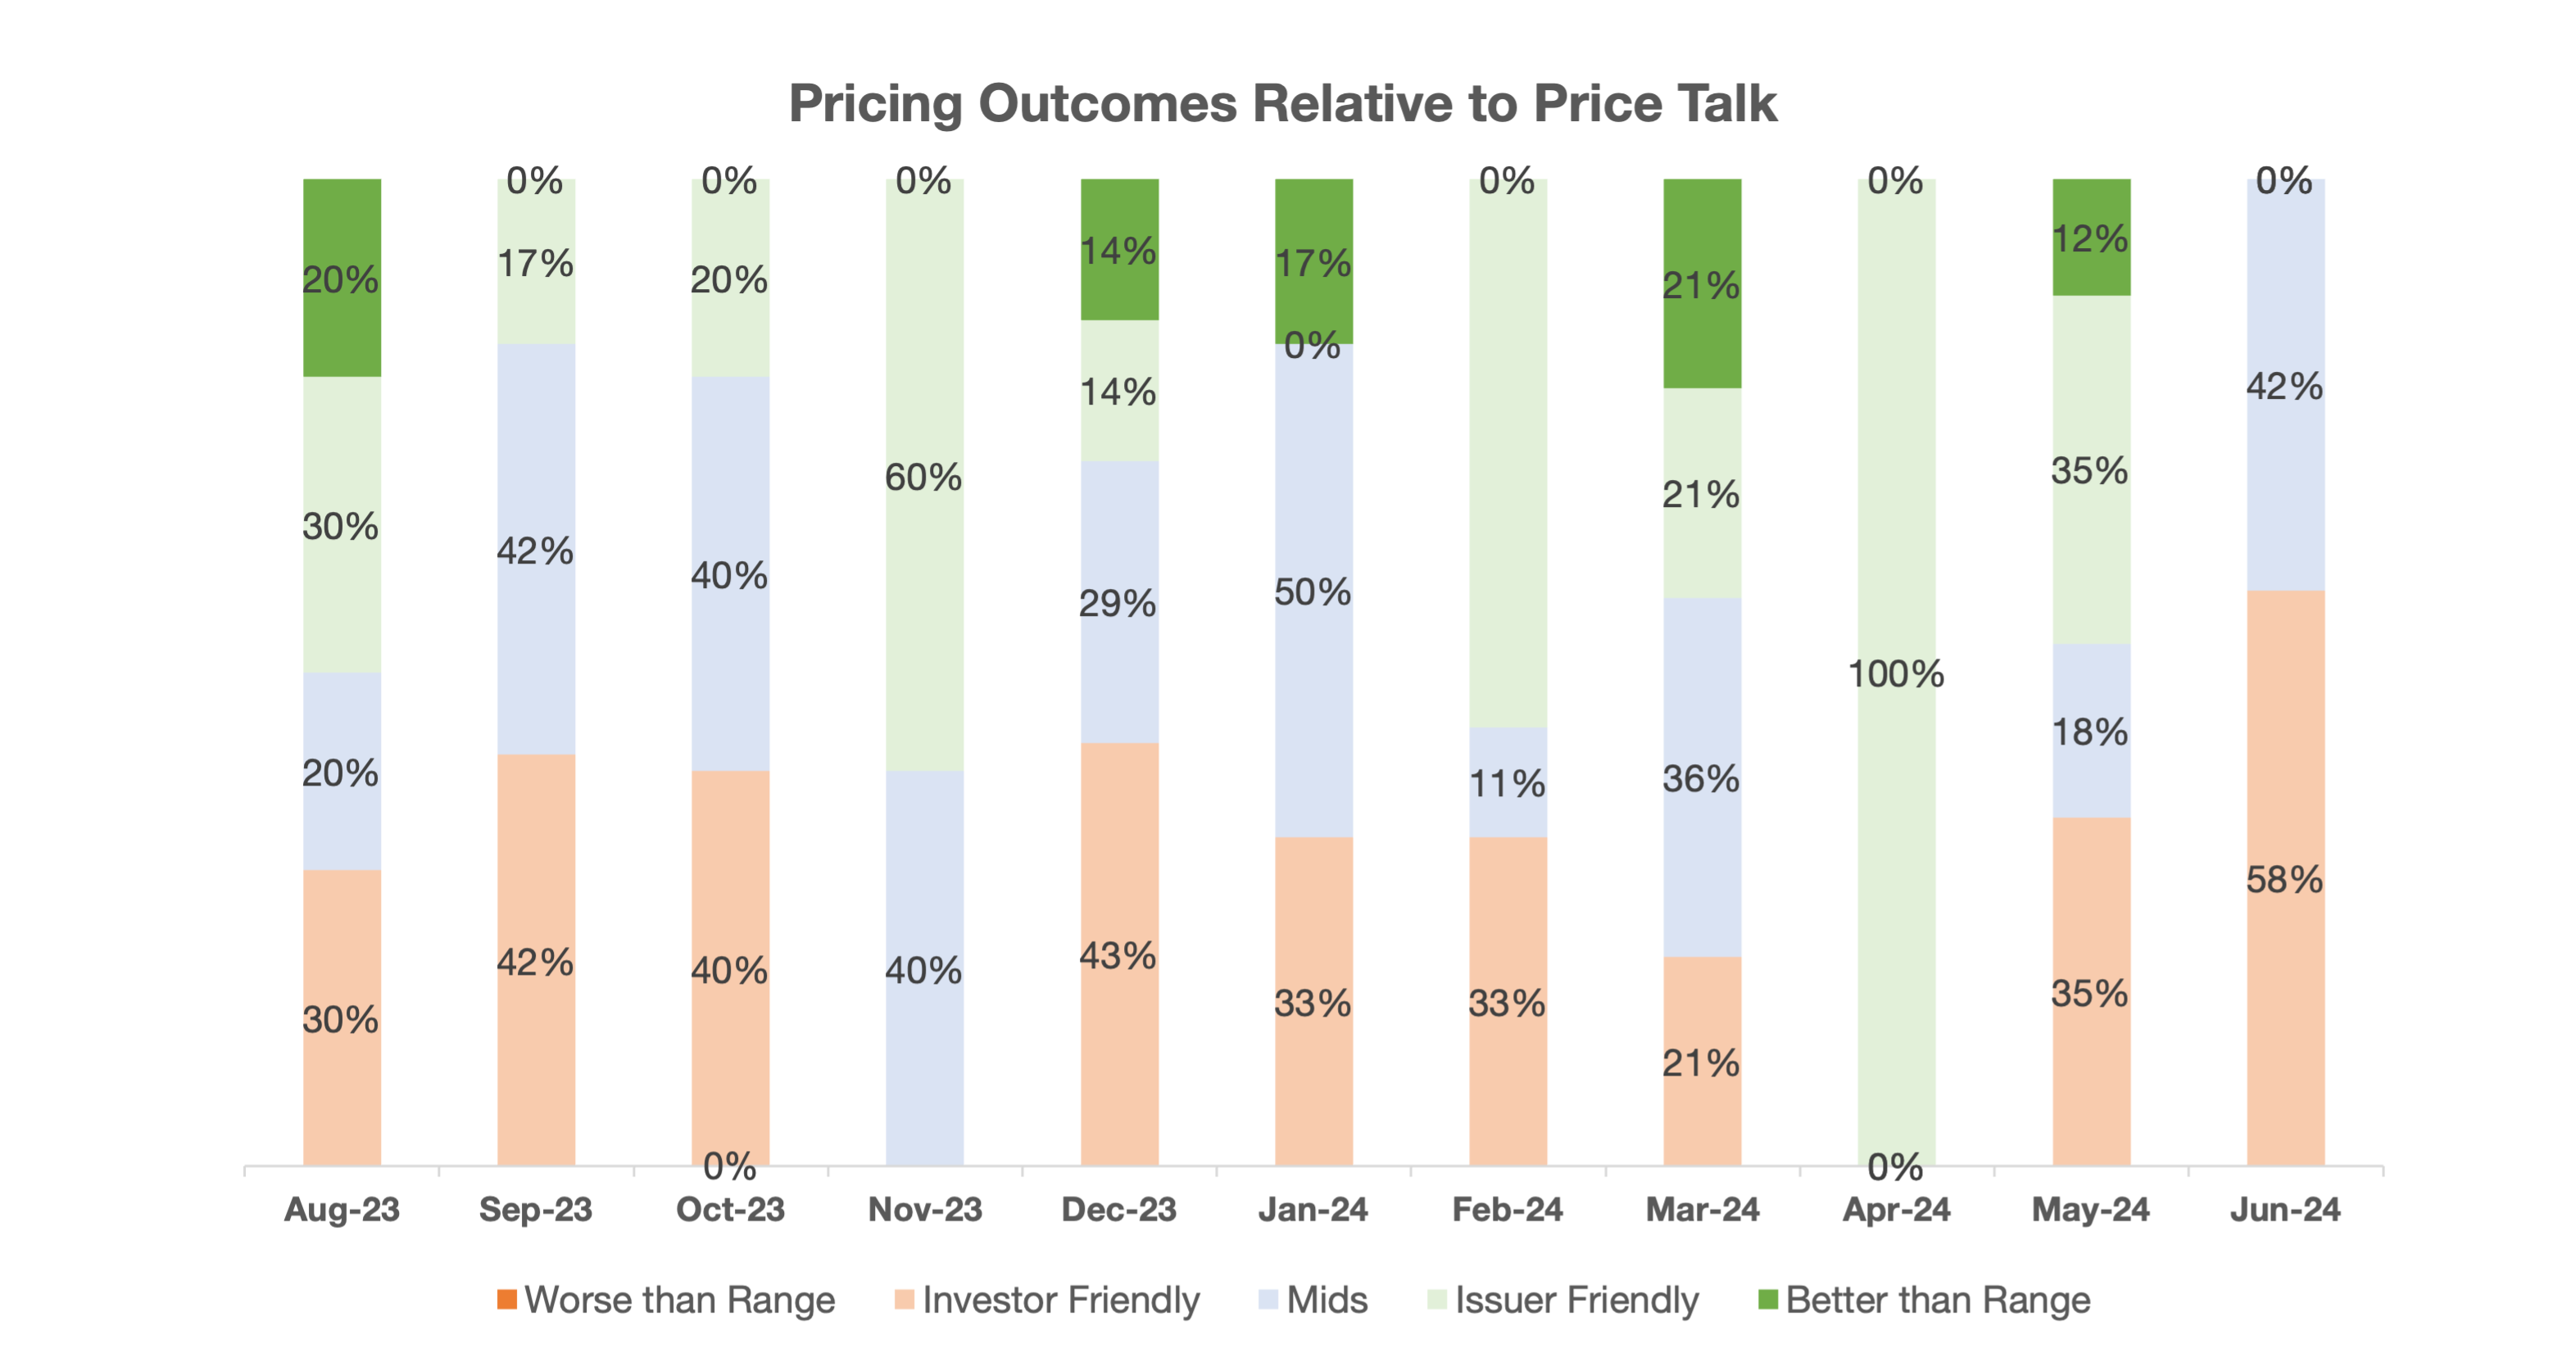
Pricing Results vs. Price Talk: As seen below, dynamics of pricing outcomes continued to evolve throughout Q2 2024. In May 2024, approximately 65% of the new issuances were priced at mid-range or better. The pricing dynamics changed in June 2024 as more than half of the deals were priced in favor of investors. The graph below details monthly pricing outcomes.
Day 1 Trading: On average for the quarter, deals traded up 1.1 points on a stock-price adjusted basis on the first day of trading, which is in line with the 1.1 point average for 2023.
Personal Views: The views expressed in this report reflect our personal views. This blog post is based on current public information that we consider reliable, but we do not represent it is accurate or complete, and it should not be relied on as such. The information, opinions, estimates and forecasts contained herein are as of the date hereof and are subject to change without prior notification. The large majority of reports by us are published at irregular intervals as appropriate in our judgment and ability to produce, so updates may not be made or available even when circumstances may have changed.
No Offer: This analysis is not an offer to sell or the solicitation of an offer to buy any security in any jurisdiction where such an offer or solicitation would be illegal. It does not constitute a personal recommendation or take into account the particular investment objectives, financial situations, or needs of individual clients. You must make an independent decision regarding investments or strategies mentioned on this website. Before acting on information on this website, you should consider whether it is suitable for your particular circumstances. You should not construe any of the material contained herein as business, financial, investment, hedging, trading, legal, regulatory, tax, or accounting advice. The price and value of investments referred to in this analysis and the income from them may fluctuate. Past performance is not a guide to future performance, future returns are not guaranteed, and a loss of original capital may occur.