
As part of our market update series, please see the summary below of what we saw in the convertible market in the second quarter of 2023 along with some key takeaways.
- Q2 volume of $14.3 billion slightly surpassed Q1 volume of $13.2 billion, and now puts 2023 on pace for ~$55 billion of issuance.
- High interest rates remain (Average 5-year UST 3.70% for Q2 and near 4% since mid-June); however, issuers seem to have adapted to this new normal as issuance levels have returned to historical averages.
- Traditional debt issuers have come to the convertible market to take advantage of lower interest rates – utilities represent an outsized portion of issuance at 30% of volume year to date.
New Issuance. Q2 2023 saw 24 new issue convertible deals (all debt) with a total volume of $14.3 billion, which is slightly greater than the $13.2 billion issued in Q1 this year. Major stock market indices continued to rally, with the S&P 500 and NASDAQ Composite each adding another 8.3% and 12.8% during Q2 and now stand at year to date gains of 15.9% and 31.7%, respectively. Average deal size was ~$600 million, which is slightly greater than market average since 2021.
The below chart shows the breakdown of deal count and volume from each sector during the quarter. Q2 saw a diversified issuer base in regard to sector breakdown, with five different sectors contributing at least 3 deals. It is also worth noting the increased activity in the Utilities sector this year; the sector’s seven deals for $8.4 billion account for ~15% and ~30% of 2023 deal count and volume. From 2017 – 2022, Utilities comprised 3.6% and 6.5% of deal count and volume.
| Sector | Deal Count | Volume ($bn) |
|---|---|---|
|
Healthcare |
6 |
2.8 |
|
Utilities |
4 |
5.1 |
|
Technology |
4 |
1.4 |
|
Real Estate |
3 |
2.2 |
|
Industrials |
3 |
1.2 |
|
Consumer |
2 |
1.0 |
|
Energy |
1 |
0.4 |
|
Financials |
1 |
0.3 |
Terms. Convertible terms have remained mostly unchanged from last quarter as coupons are about 40 bps tighter but conversion premiums about 4% lower. The average yield for 5-year US Treasury Bonds, on a quarterly basis, came in slightly below Q1 (3.70% vs. 3,81%); however, the rate had been around 4% since mid-June.
Average New Issue Coupon Rate and Conversion Premium 2021-2023 YTD
| Sector | 2021 | H1 2022 | H2 2022 | Q1 2023 | Q2 2023 |
|---|---|---|---|---|---|
|
All Deals |
1.05% / 38% |
2.85% / 31% |
3.52% / 28% |
3.76% / 30% |
3.33% / 26% |
|
Technology |
0.38% / 42% |
2.02% / 33% |
2.91% / 31% |
3.14% / 30% |
1.96% / 28% |
|
Healthcare |
1.59% / 34% |
2.44% / 33% |
3.07% / 29% |
2.33% / 29% |
2.97% / 28% |
|
Average 5y UST |
0.86% |
2.39% |
3.61% |
3.81% |
3.70% |
The recent Utilities deals described above tend to have a different profile than convertible bonds from other sectors, as they are treated by issuers as short-term debt replacements. As such they tend to come with shorter maturities (e.g., 3 years instead of the typical 5 years), and because the underlying stocks themselves are lower volatility and higher dividend, coupons tend to be higher (close to 4% is common). Average coupon and conversion premium for Utilities deals this year are 3.70% and 24%.
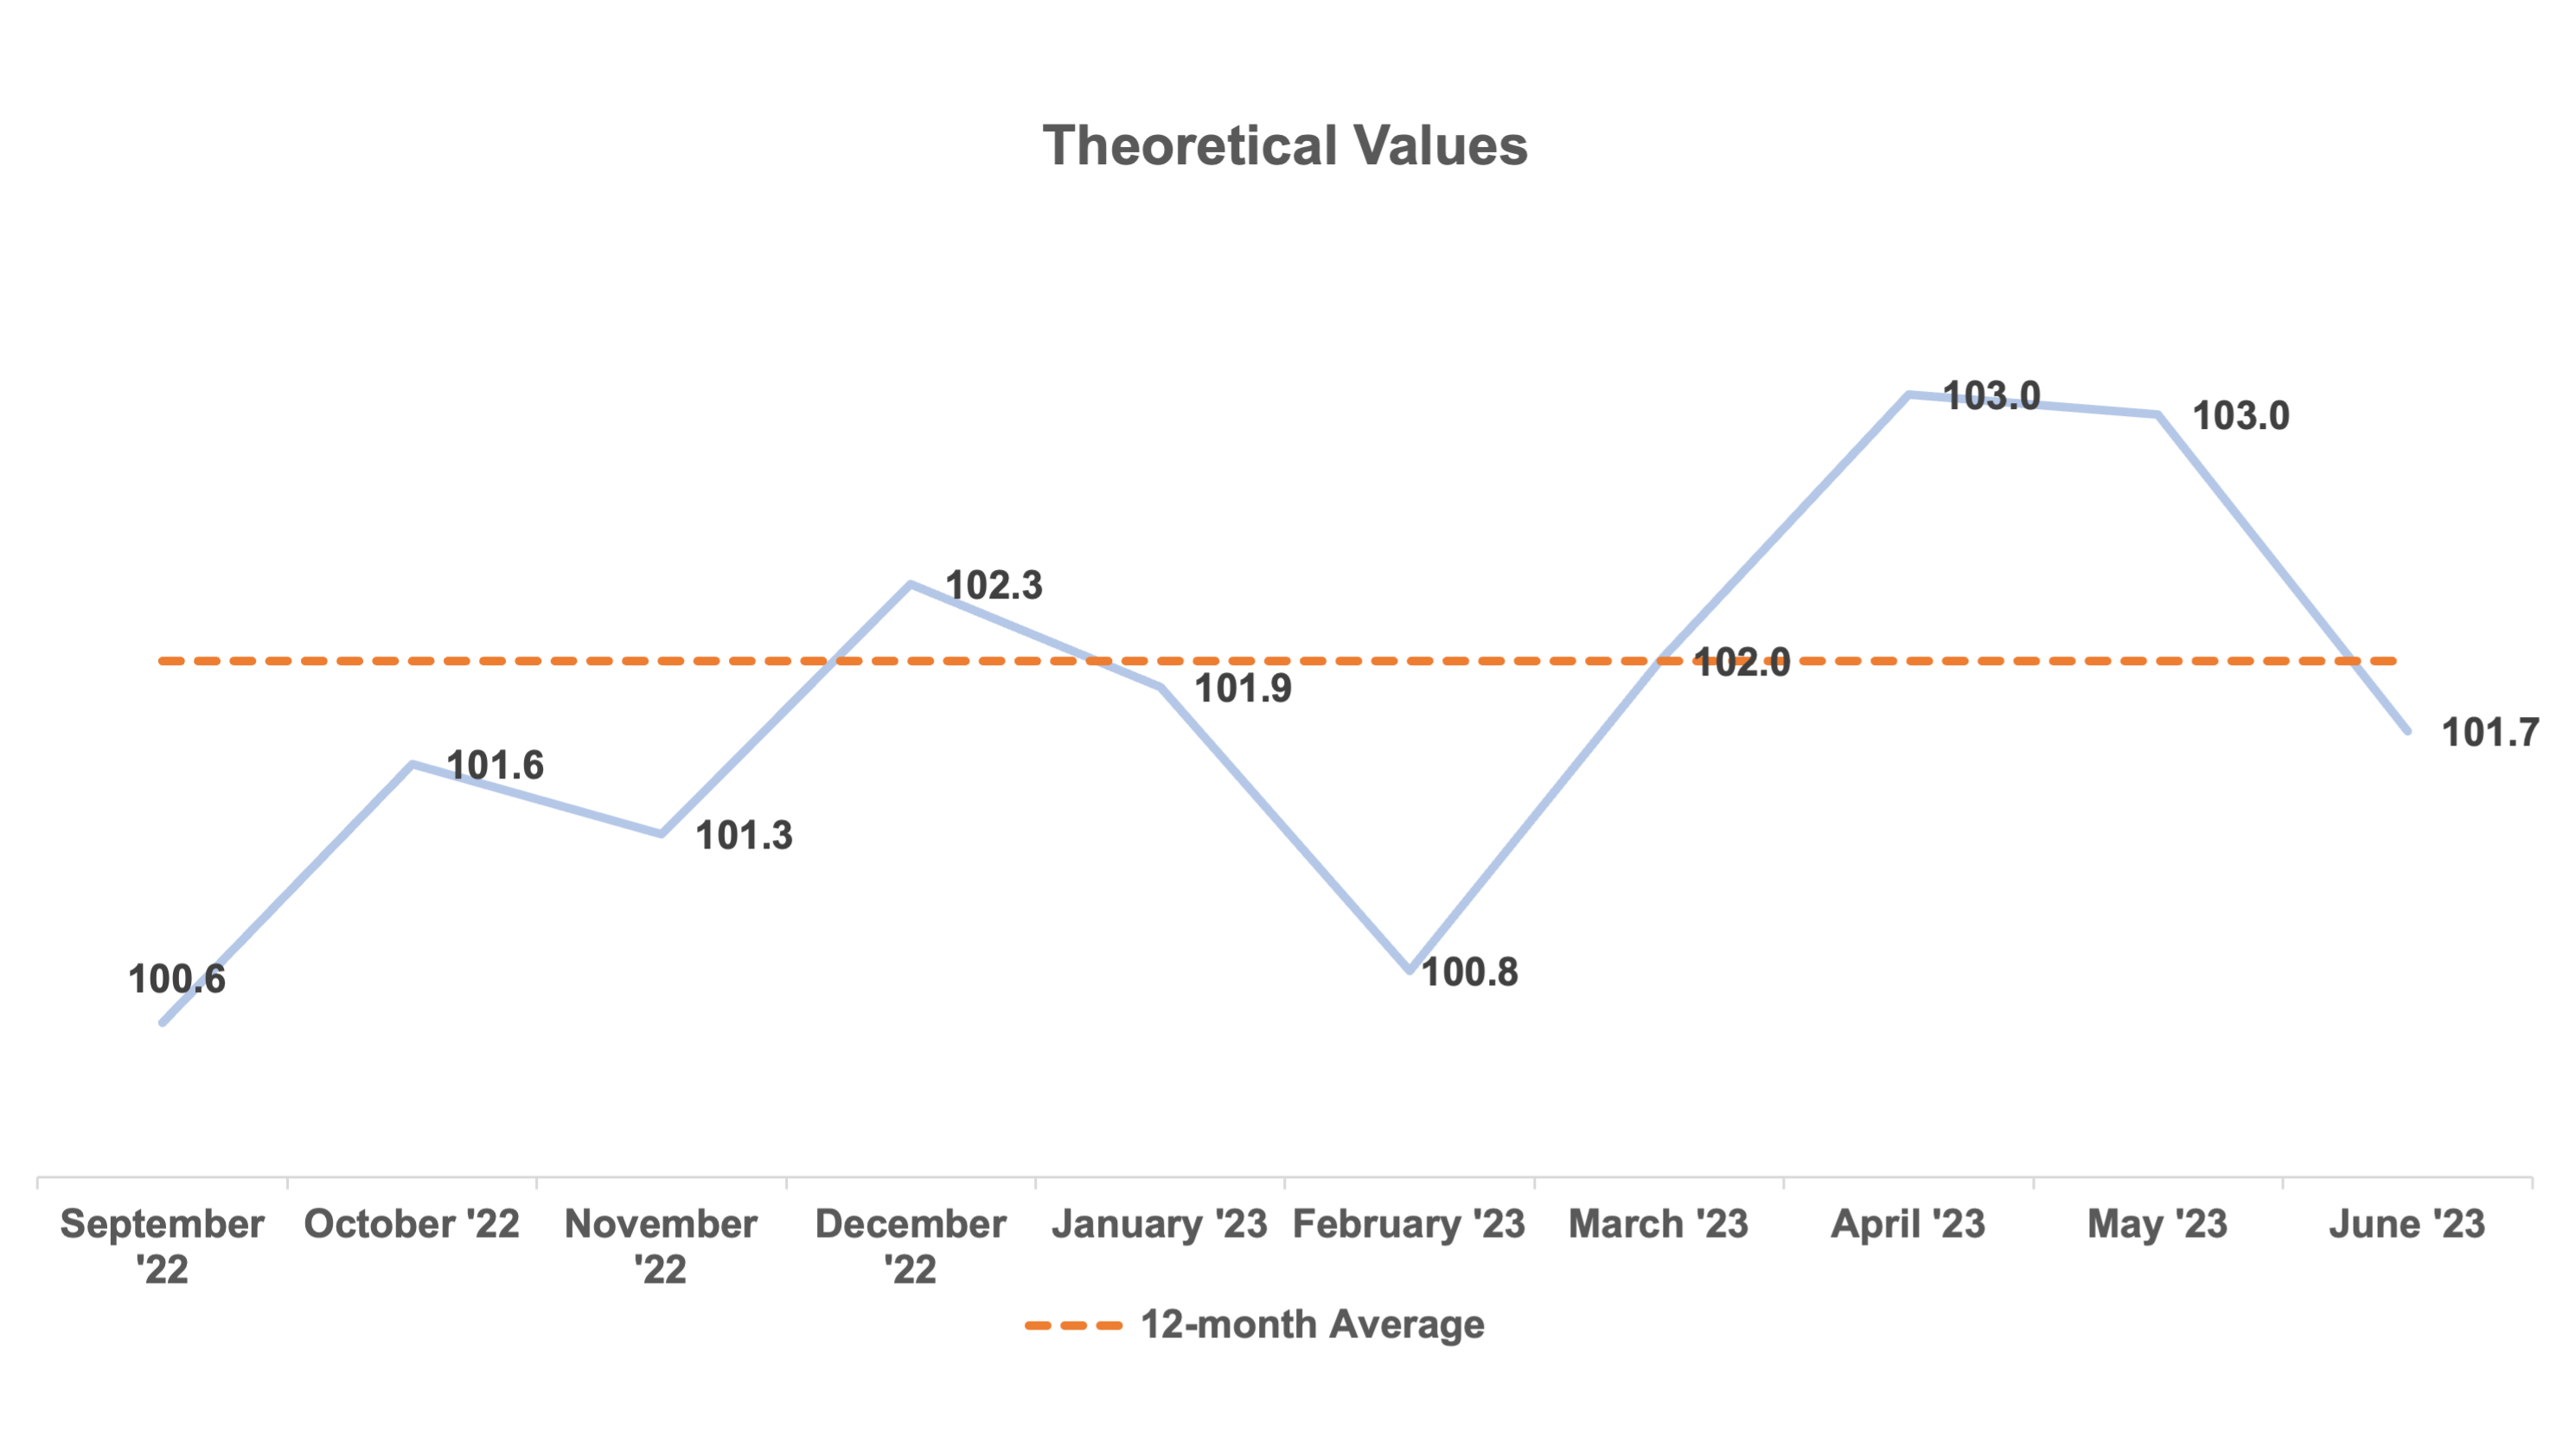
Pricing Results: Theoretical Value. The average theoretical value for Q2 was 102.5, with greater cheapness occurring during the beginning of the quarter during April and May. The trailing 12-month average now stands at 102.0, which is in-line with the typical long run average of 102.0 – 102.5.
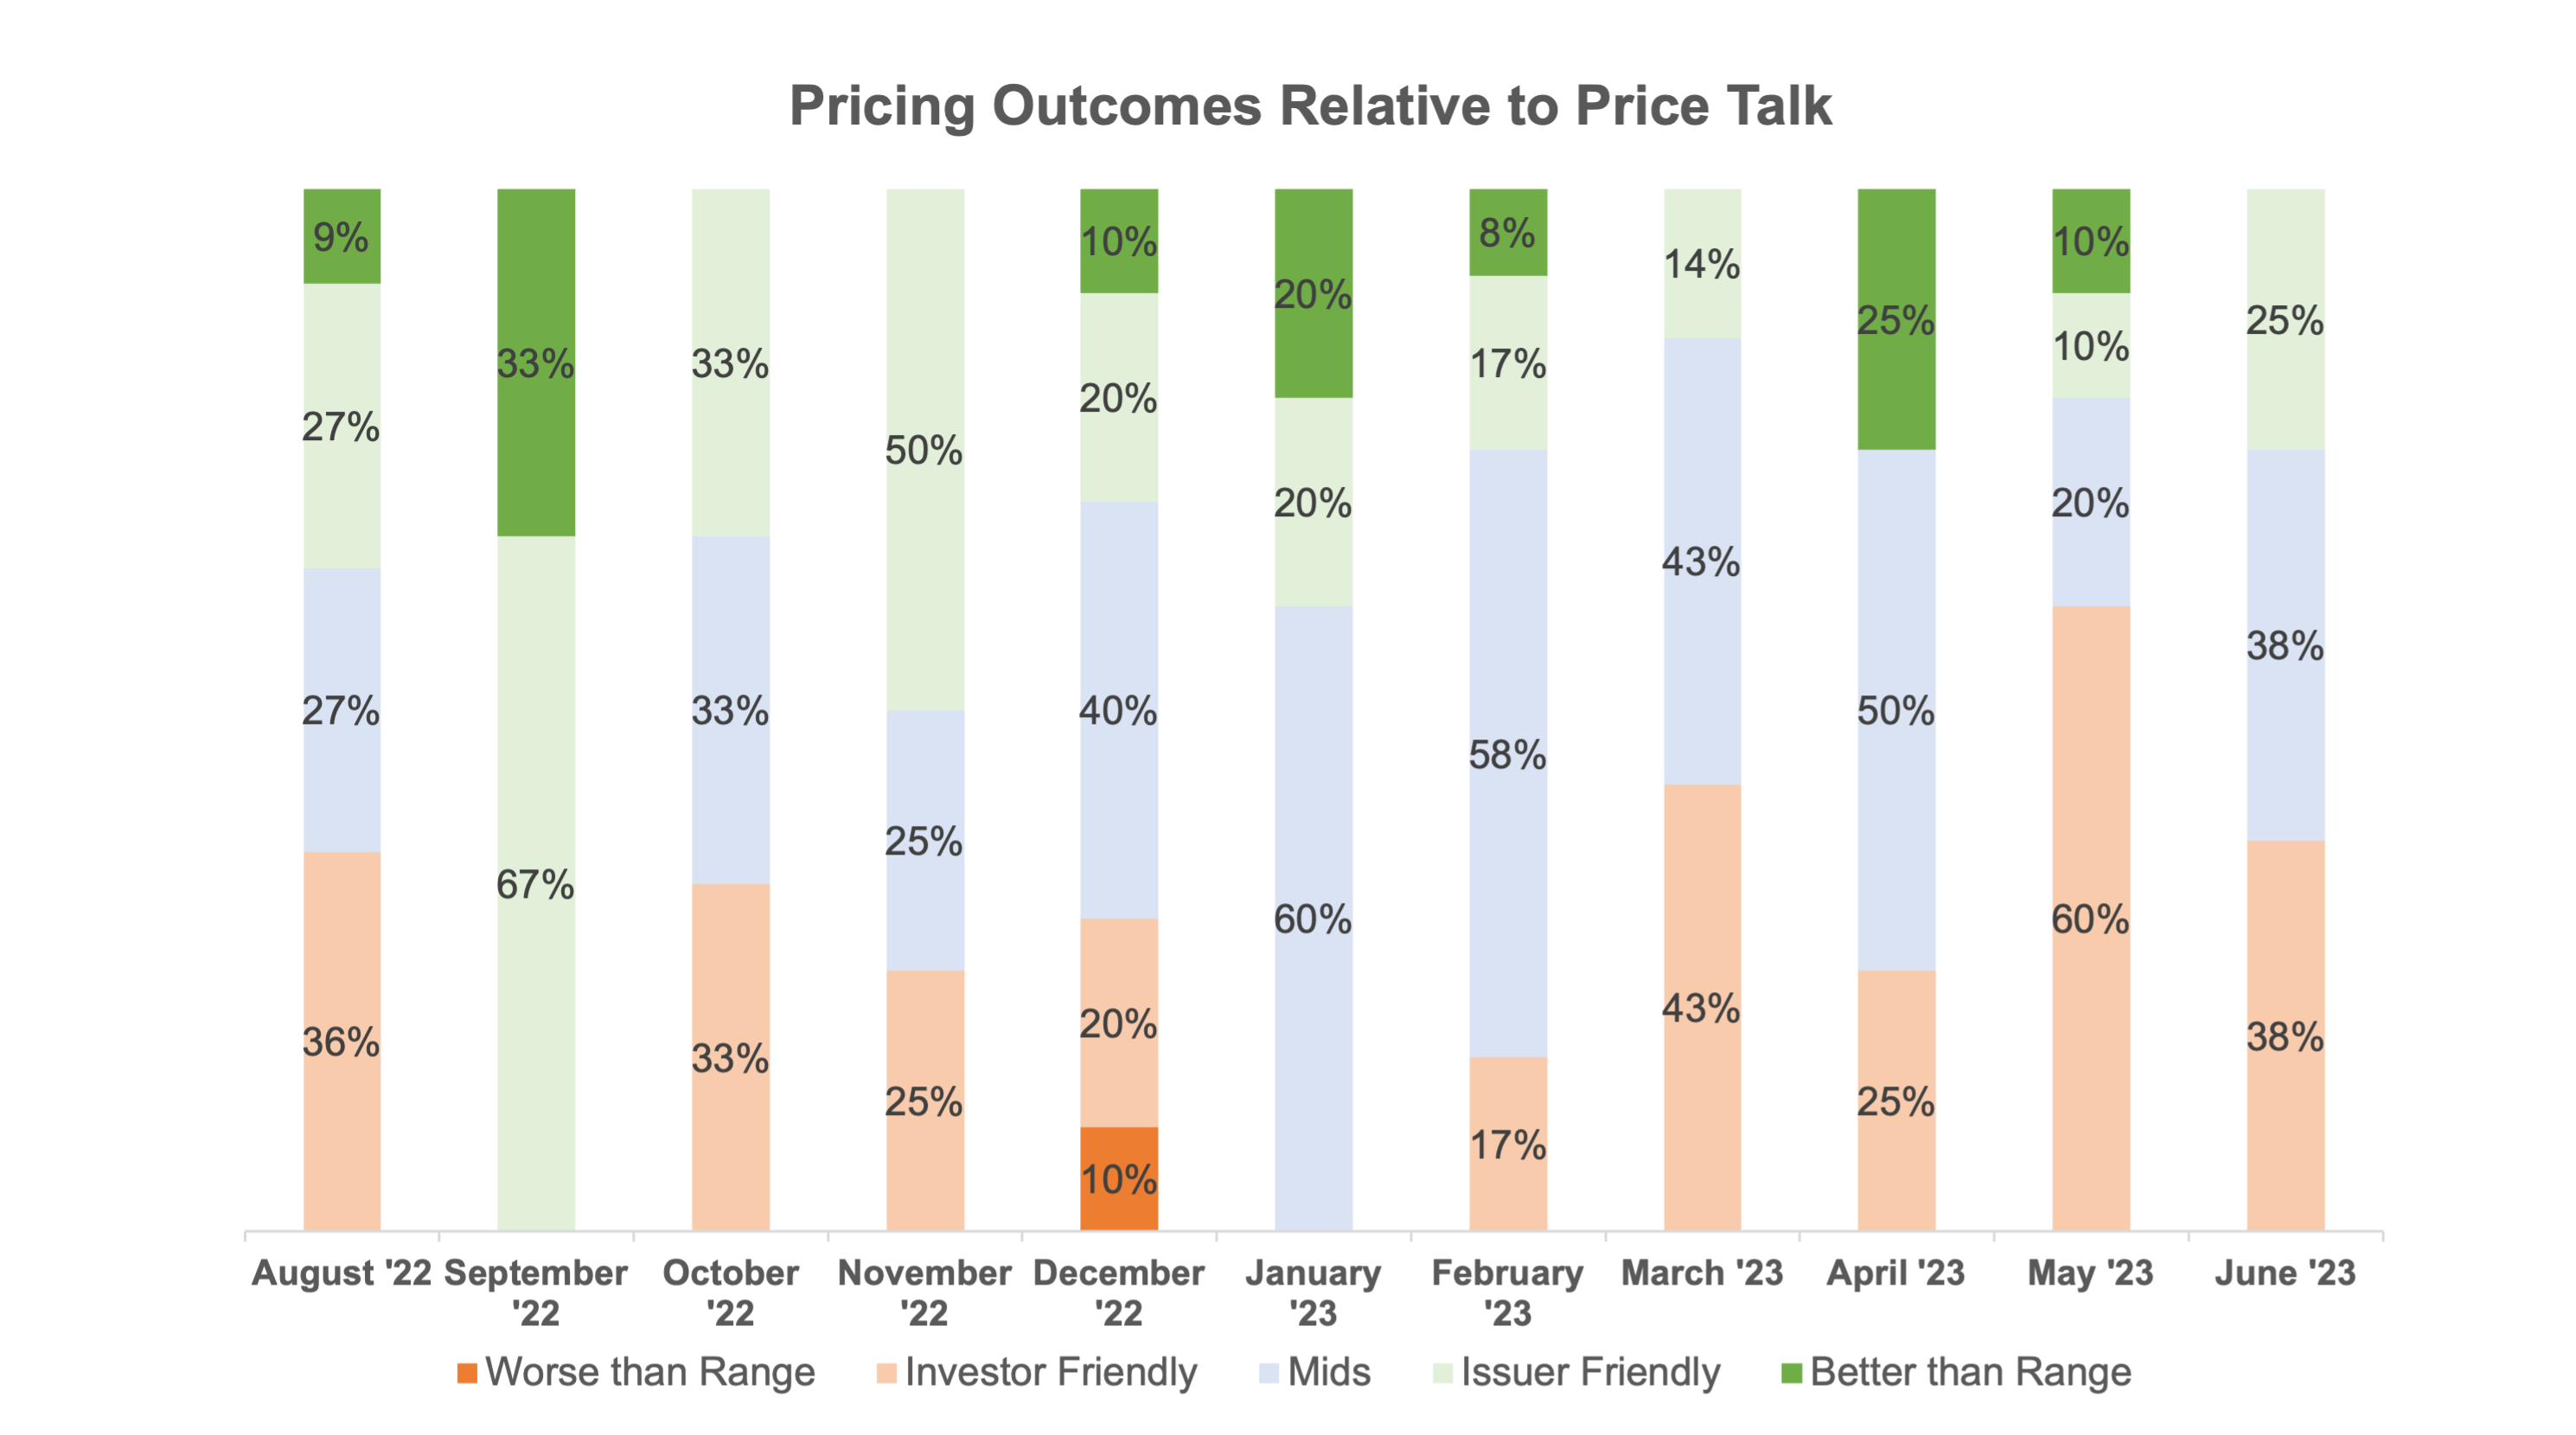
Pricing Results vs. Price Talk. As can be seen in greater detail below, pricing seemed to favor investors slightly during Q2, but was still relatively balanced across the marketing range.
Day 1 Trading. On average for the quarter, deals traded up 1.0 points on a stock-price adjusted basis on the first day of trading compared to a 1.2 point average in Q1 and 1.5 average in 2022. It appears that the market is healthy for issuers given that investors are requiring a less than normal concession.
Personal Views: The views expressed in this report reflect our personal views. This blog post is based on current public information that we consider reliable, but we do not represent it is accurate or complete, and it should not be relied on as such. The information, opinions, estimates and forecasts contained herein are as of the date hereof and are subject to change without prior notification. The large majority of reports by us are published at irregular intervals as appropriate in our judgment and ability to produce, so updates may not be made or available even when circumstances may have changed.
No Offer: This analysis is not an offer to sell or the solicitation of an offer to buy any security in any jurisdiction where such an offer or solicitation would be illegal. It does not constitute a personal recommendation or take into account the particular investment objectives, financial situations, or needs of individual clients. You must make an independent decision regarding investments or strategies mentioned on this website. Before acting on information on this website, you should consider whether it is suitable for your particular circumstances. You should not construe any of the material contained herein as business, financial, investment, hedging, trading, legal, regulatory, tax, or accounting advice. The price and value of investments referred to in this analysis and the income from them may fluctuate. Past performance is not a guide to future performance, future returns are not guaranteed, and a loss of original capital may occur.