
As part of our market update series, please see the summary below of what we saw in the convertible market in Q2 2022.
- New Issuance. The convertible market continues to see a slow down in new issue paper with 10 deals in Q2 (all debt) worth $3.4bn. This level of issuance is the lowest in the past five years (in Q4 2017 we saw $3.4bn across 11 deals). The equity markets continued their sell-off from Q1, with S&P 500 down ~16% and Nasdaq down ~22% for the quarter. Rates also saw a dramatic rise, as the 5y UST averaged 2.95% for the quarter (1.83% avg. in Q1).
Similarly to historical trends, Healthcare and Technology were the most frequent sectors to tap the convertible market. Each sector contributed 3 deals, raising $1.6bn and $775mm, respectively. The other 4 deals were issued out of the Real Estate, Financial, and Utilities sectors.
- Terms. As interest rates continue to move higher, we see convertibles pricing with higher coupons and lower conversion premiums. The wider (i.e., worse for issuers) quarterly average statistics may also be a result of a shift away from large-cap companies (that raise capital opportunistically when costs are low) toward those that need to raise money, even if terms are worse. With the June CPI report coming in at 9.1% and the Fed’s intention to continue to raise interest rates, it is reasonable to expect that wider terms are likely to be the “new normal” for a while.
Average New Issue Coupon Rate and Conversion Premium 2019-2022 YTD
| Sector | 2019 | 2020 | Q1 2021 | Q2 2021 | Q3 2021 | Q4 2021 | Q1 2022 | Q2 2022 |
|---|---|---|---|---|---|---|---|---|
|
All Deals Average |
2.20% / 30% |
2.06% / 33% |
0.89% / 41% |
1.15% / 35% |
1.23% / 37% |
1.20% / 38% |
2.02% / 35% |
3.75% / 27% |
|
Tech Sector Average |
1.30% / 34% |
1.34% / 36% |
0.15% / 46% |
0.34% / 39% |
0.58% / 42% |
0.45% / 40% |
0.88% / 39% |
3.75% / 28% |
|
Healthcare Sector Average |
2.59% / 29% |
2.45% / 29% |
1.43% / 36% |
1.08% / 32% |
2.38% / 32% |
1.88% / 28% |
2.21% / 38% |
2.67% / 29% |
|
Average 5y UST |
1.95% |
0.53% |
0.62% |
0.84% |
0.80% |
1.18% |
1.83% |
2.95% |
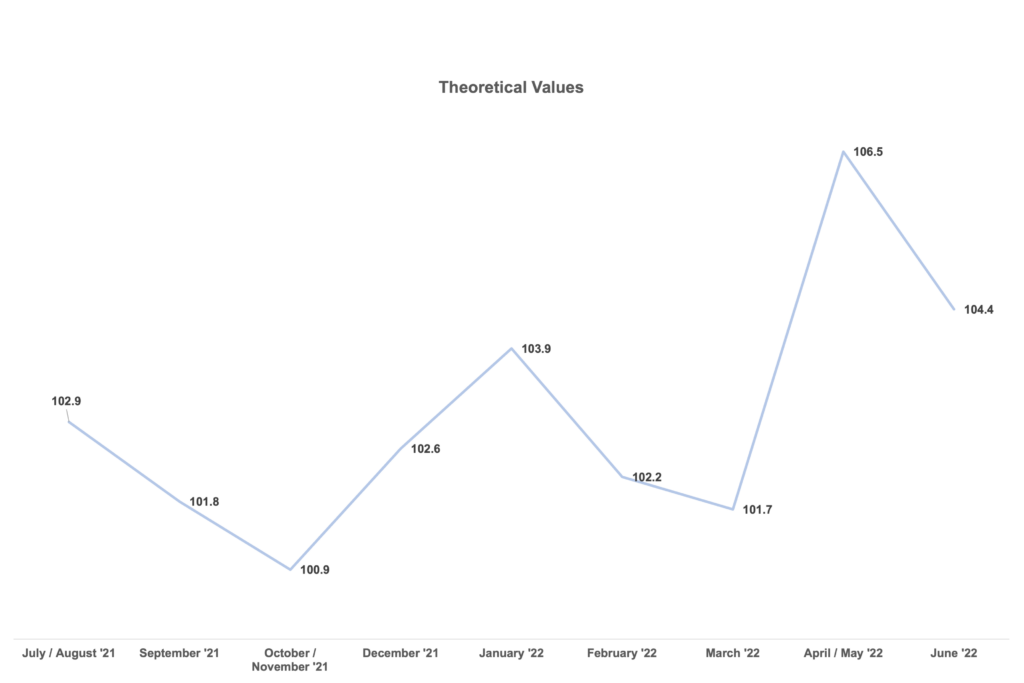
- Pricing Results: Theoretical Value. We have updated the theoretical value graph below with Q2 ‘22 data, showing how much cheapness deals were ultimately priced with. The Q2 average was 105.6, with a peak coming in April and May. Given the typical long run average range of 102 – 102.5%, deals priced with a considerable discount. The last time cheapness levels were this high was April/May 2020 during the peak of COVID (104.5).
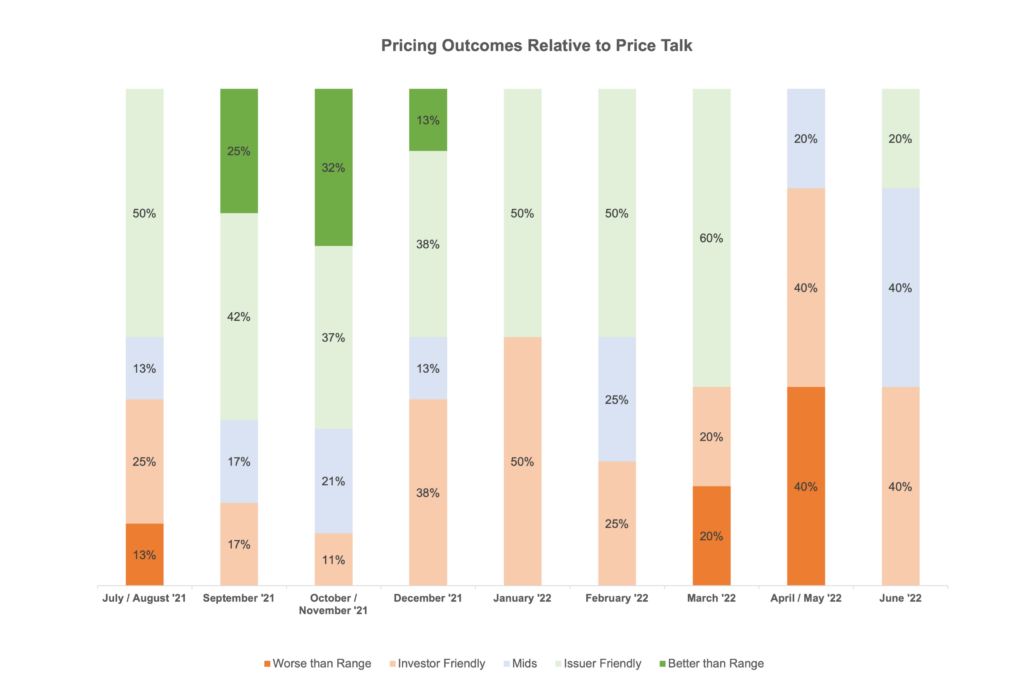
- Pricing Results vs. Price Talk. Per the below, deals priced more frequently on the investor-friendly side of the marketing range than on the issuer-friendly side throughout Q2. However, we saw a more favorable market window in June with a higher frequency of deals pricing at the midpoints and issuer-friendly side of the range. This is congruent with the previous theoretical value chart, which shows that the discount that investors warranted to participate in deals dropped.
- Day 1 Trading. On average, for the quarter, deals traded up 0.7 points on a stock-price adjusted basis on the first day of trading compared to a 1.2 point average in Q1 and 1.8 point average for 2021. The lower “expansion” in the secondary market indicates that investors haven’t been able to flip these “cheap” deals to make a profit and that issuers may actually be maintaining a considerable amount of value.
Personal Views: The views expressed in this report reflect our personal views. This blog post is based on current public information that we consider reliable, but we do not represent it is accurate or complete, and it should not be relied on as such. The information, opinions, estimates and forecasts contained herein are as of the date hereof and are subject to change without prior notification. The large majority of reports by us are published at irregular intervals as appropriate in our judgment and ability to produce, so updates may not be made or available even when circumstances may have changed.
No Offer: This analysis is not an offer to sell or the solicitation of an offer to buy any security in any jurisdiction where such an offer or solicitation would be illegal. It does not constitute a personal recommendation or take into account the particular investment objectives, financial situations, or needs of individual clients. You must make an independent decision regarding investments or strategies mentioned on this website. Before acting on information on this website, you should consider whether it is suitable for your particular circumstances. You should not construe any of the material contained herein as business, financial, investment, hedging, trading, legal, regulatory, tax, or accounting advice. The price and value of investments referred to in this analysis and the income from them may fluctuate. Past performance is not a guide to future performance, future returns are not guaranteed, and a loss of original capital may occur.