
As part of our market update series, please see the summary below of what we saw in the convertible market in Q1 2022.
- New Issuance. Q1 2022 saw 11 new issue convertible deals (all debt) with a total volume of $6.1bn, which marks the lowest level of issuance since Q4 2018 ($5.3bn across 16 deals). The sell off in equities and increase in interest rates has led some issuers to pause their plans on raising capital in the convertible market. Average deal size was ~$550mm, which was slightly less than ~$590mm size in 2021.
The 11 transactions from Q1 were fairly spread out. Technology and Healthcare each contributed 3 deals for $3.1bn and $1.2bn respectively, while 2 more deals came from the Industrials sector for $713mm. The remaining convertibles were issued out of the Energy, Real Estate, and Consumer Cyclical sectors.
- Terms. As seen below, terms widened from 2021, though this was in sync with a rising interest rate environment (as the best terms in early 2021 coincided with an extraordinarily low-rate environment). Even with equity markets off highs from Q4 and investors exercising greater caution, the convertible market remains active for those looking to raise capital, with terms normalizing closer to long run averages. Moving into Q2, companies deciding on whether or not to raise capital will have to balance the prospects of the Fed raising interest rates with lower than optimal share prices to price off of.
| Sector | 2019 | 2020 | Q1 2021 | Q2 2021 | Q3 2021 | Q4 2021 | Q1 2022 |
|---|---|---|---|---|---|---|---|
|
All Deals Average |
2.20% / 30% |
2.06% / 33% |
0.89% / 41% |
1.15% / 35% |
1.23% / 37% |
1.20% / 38% |
2.02% / 35% |
|
Tech Sector Average |
1.30% / 34% |
1.34% / 36% |
0.15% / 46% |
0.34% / 39% |
0.58% / 42% |
0.45% / 40% |
0.88% / 39% |
|
Average 5y UST |
1.95% |
0.53% |
0.62% |
0.84% |
0.80% |
1.18% |
1.83% |
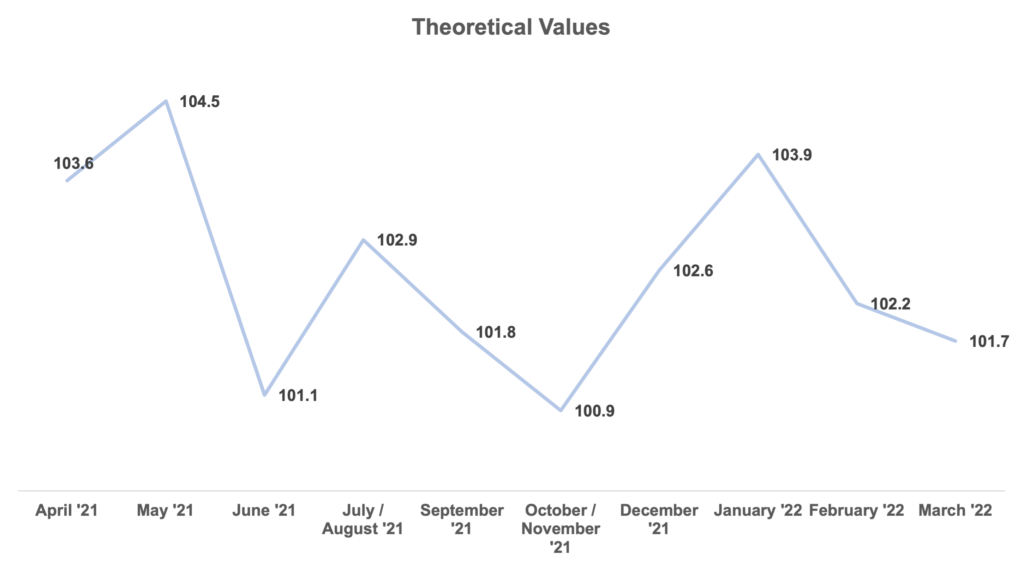
- Pricing Results: Theoretical Value. We have updated the theoretical value graph below with Q1 ‘22 data, showing how much cheapness deals were ultimately priced with. The Q1 average was 102.3, which is in the typical long run average range of 102 – 102.5%. Theoretical values trended down throughout the quarter, potentially signaling an increase in deal receptivity by investors due to lack of supply.
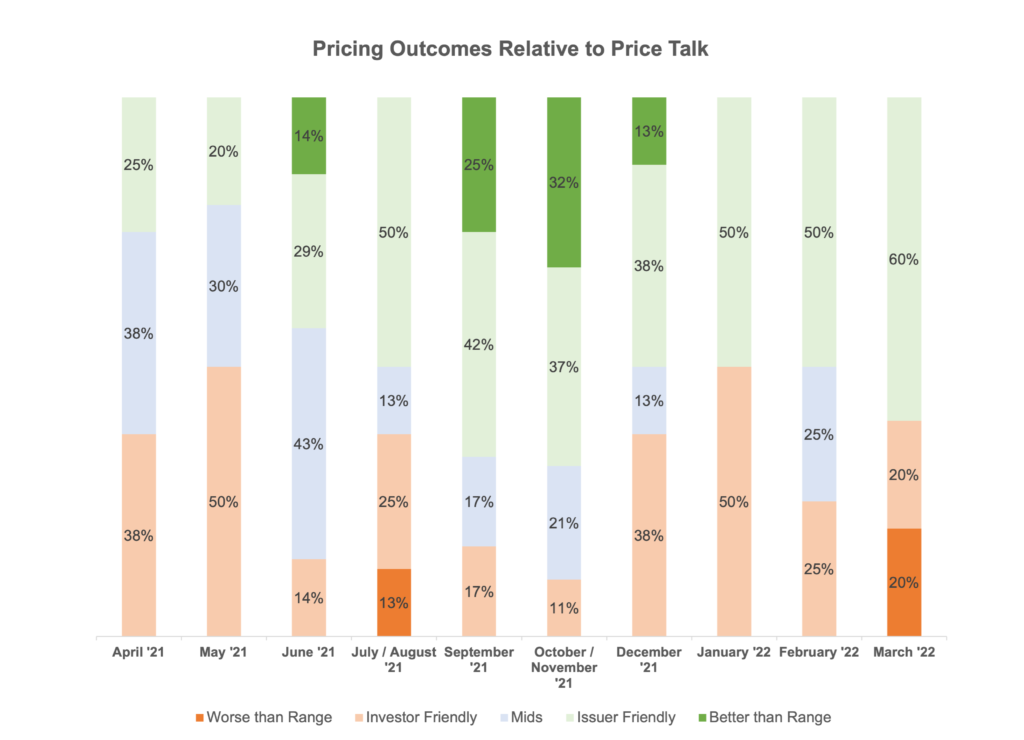
- Pricing Results vs. Price Talk. Per the below, deals priced slightly more frequently on the issuer-friendly side of the marketing range than on the investor side throughout Q1. Even with heightened volatility throughout the quarter, the fact that over 50% of deals priced at the issuer-friendly end of the marketing range is a good sign that the market is still open; however, with some deals pricing outside of the range (due to the heightened volatility), it is imperative that the launch terms are appropriate to ensure a successful outcome.
- Day 1 Trading. On average, for the quarter, deals traded up 2.1 points on a stock-price adjusted basis on the first day of trading (2.4 points in October / November and 1.6 points in December), compared to a 1.7 point average for the first three quarters of 2021. The smaller trading performance in December is consistent with the risk-off mentality as investors held back in the secondary market as they did in marketing processes. All of these numbers, however, are within normal variations of the market. On average, for the quarter, deals traded up 1.2 points on a stock-price adjusted basis on the first day of trading compared to a ~1.8 point average for 2021. The lower “expansion” in the secondary market is another way of representing the new issue concession for an issuer pricing a convertible offering. While the market may not be red hot like it was in 2020 and 2021, if it was truly soft, there would be greater pricing concessions demanded by investors with more deals pricing towards the investor side of the marketing range.
Personal Views: The views expressed in this report reflect our personal views. This blog post is based on current public information that we consider reliable, but we do not represent it is accurate or complete, and it should not be relied on as such. The information, opinions, estimates and forecasts contained herein are as of the date hereof and are subject to change without prior notification. The large majority of reports by us are published at irregular intervals as appropriate in our judgment and ability to produce, so updates may not be made or available even when circumstances may have changed.
No Offer: This analysis is not an offer to sell or the solicitation of an offer to buy any security in any jurisdiction where such an offer or solicitation would be illegal. It does not constitute a personal recommendation or take into account the particular investment objectives, financial situations, or needs of individual clients. You must make an independent decision regarding investments or strategies mentioned on this website. Before acting on information on this website, you should consider whether it is suitable for your particular circumstances. You should not construe any of the material contained herein as business, financial, investment, hedging, trading, legal, regulatory, tax, or accounting advice. The price and value of investments referred to in this analysis and the income from them may fluctuate. Past performance is not a guide to future performance, future returns are not guaranteed, and a loss of original capital may occur.