
As part of our market update series, please see the summary below of what we saw in the convertible market in October and November 2020.
- New Issuance. October and November 2020 saw 5 and 12 new issue convertible deals, with dollar volumes of $2.0 billion and $8.7 billion, respectively. The 2020 year to date total stands at $98 billion in 168 deals, compared to full year totals in 2018 and 2019 of $47 billion and $57 billion.
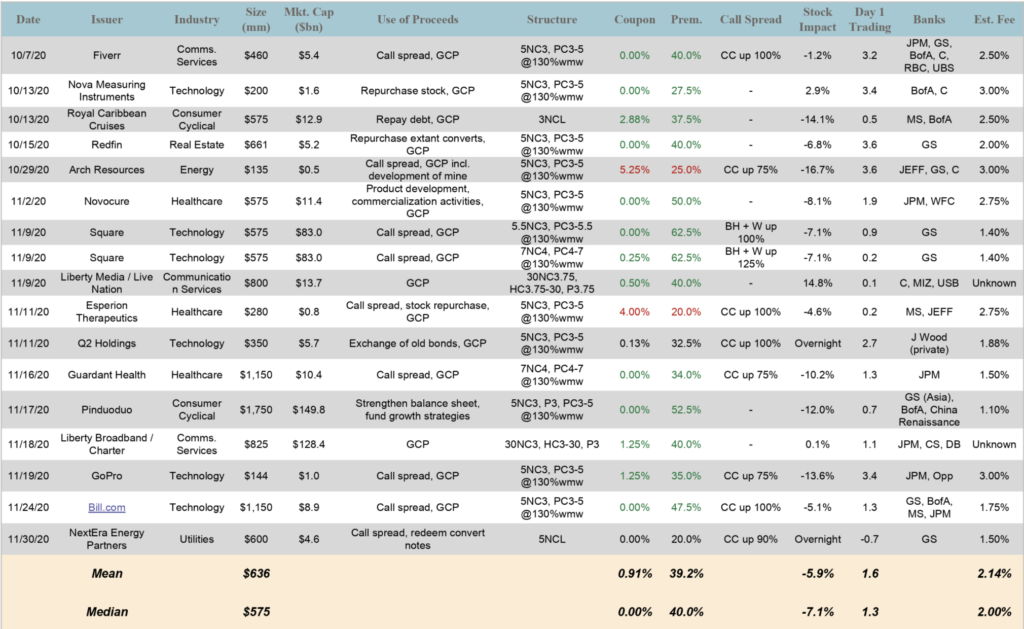
Tech / Communications deals represented 9 of the 17 deals, with an additional 3 from the healthcare sector.
- Terms. In the table below, we compare terms to previous periods both before and after the Covid-19 pandemic. The statistics for Q4 to date were extremely attractive, with deals such as the dual-tranche Square offering pricing at 0% up 62.5% for a 5.5 year and 0.25% up 62.5% for a 7 year.
There were several other data points that the aggressiveness of the market took even underwriters by surprise. Of the 17 transactions, 10 (59%) priced better than the range from the issuer’s perspective; compared to 19 of 151 (13%) achieving this in the first 9 months of the year.
In addition, while the the average model value of terms was, based on marketing credit / volatility assumptions, 102.3% of par during this period, in line with a ~102 longer-run average, several deals (Redfin, Square, Guardant Health, and NextEra Energy Partners) priced at levels modeling to less than par.
| Sector | 2019 Full Year | Q1 2020 | Q2 2020 | Q3 2020 | Oct.-Nov. 2020 |
| All Deals Avg. | 2.20% / 30% | 1.25% / 37% | 2.53% / 29% | 2.10% / 34% | 0.91% / 39% |
| Tech Sector Avg. | 1.30% / 34% | 1.04% / 37% | 1.60% / 31% | 1.54% / 37% | 0.38% / 43% |
- Day 1 Trading. Deals on average traded on a stock-adjusted basis in line with their long-run average, +1.6 points, with the larger deals ($500mm+) trading up on average 1.0 point and smaller deals +2.7.
- Secondary Market. Finally, we are updating our data tracking that we launched earlier in the year tracking the dislocation in the convertible secondary trading market for a fixed universe of bonds since pre-Covid-19 in February.The market has now recovered to a point where our universe of bonds (on average) is trading at a higher implied price than pre-Covid-19. This is more confirmation that it is an attractive time to be an issuer in this market.
| Date | S&P 500 | Secondary Market Dislocation | Approx.Coupon Increase |
| 13-Feb (benchmark) | 3,374 | 0.0 | – |
| 13-Mar | 2,711 | -5.8 | +1.5% |
| 24-Mar | 2,447 | -11.5 | +3.0% |
| 6-Apr | 2,664 | -9.5 | +2.5% |
| 17-Apr | 2,875 | -7.4 | +1.9% |
| 30-Apr | 2,912 | -6.7 | +1.7% |
| 4-Jun | 3,112 | -6.2 | +1.6% |
| 30-Jun | 3,100 | -6.5 | +1.7% |
| 31-Jul | 3,271 | -4.0 | +1.0% |
| 31-Aug | 3,500 | -2.1 | +0.5% |
| 2-Oct | 3,348 | -1.6 | +0.4% |
| 4-Dec | 3,699 | +0.7 | -0.2% |
¹ All transaction totals include mandatory convertible issuance in addition to convertible debt.