
With Federal Reserve tightening and geopolitical uncertainty rising in the last few months, we have seen gains accumulated during COVID dissipate since the start of the year. Consequently, US secondary markets have caused drastic shifts in primary issuance behavior in each of the major financing markets.
In this blog post, we review the recent trading and issuance dynamics of the Equity, Convertible, High Yield (HY) and Investment Grade (IG) markets, and what that means for issuers contemplating financing in 2022 (or later). The key takeaways are:
- Market returns across all asset classes are at least moderately negative YTD and there have been significant capital outflows out of riskier asset classes
- The convertible market is down significantly on an outright basis; convertible arbitrage investors are only down low single digits, but for a market-neutral strategy, being down at all leads to a more conservative posture among the principal providers of liquidity in that market
- Issuance volumes are down significantly in the Equity, Convertible, and High Yield markets while the Investment Grade market is seeing close to normal volumes
- New issue deals are trading up modestly, which indicates that the new issue market is open and functioning reasonably in the face of current economic conditions
- However, terms (especially in the convertible market) are much wider than where they were at the start of the year; for example, a hypothetical convertible and straight debt coupons for a B-rated issuer are ~2.3% and ~2.9% higher, respectively
Secondary Market Behavior
We first focus on the secondary markets. In general, when investors are struggling in the secondary market, their willingness to participate in new deals, especially at aggressive levels, declines. Conversely, when secondary markets are performing well, investors are willing to participate in new deals in larger size and at more aggressive prices.
Markets have been under pressure since the start of 2022, but the move has accelerated over the last two months. The below chart shows YTD moves of major indices in each market.
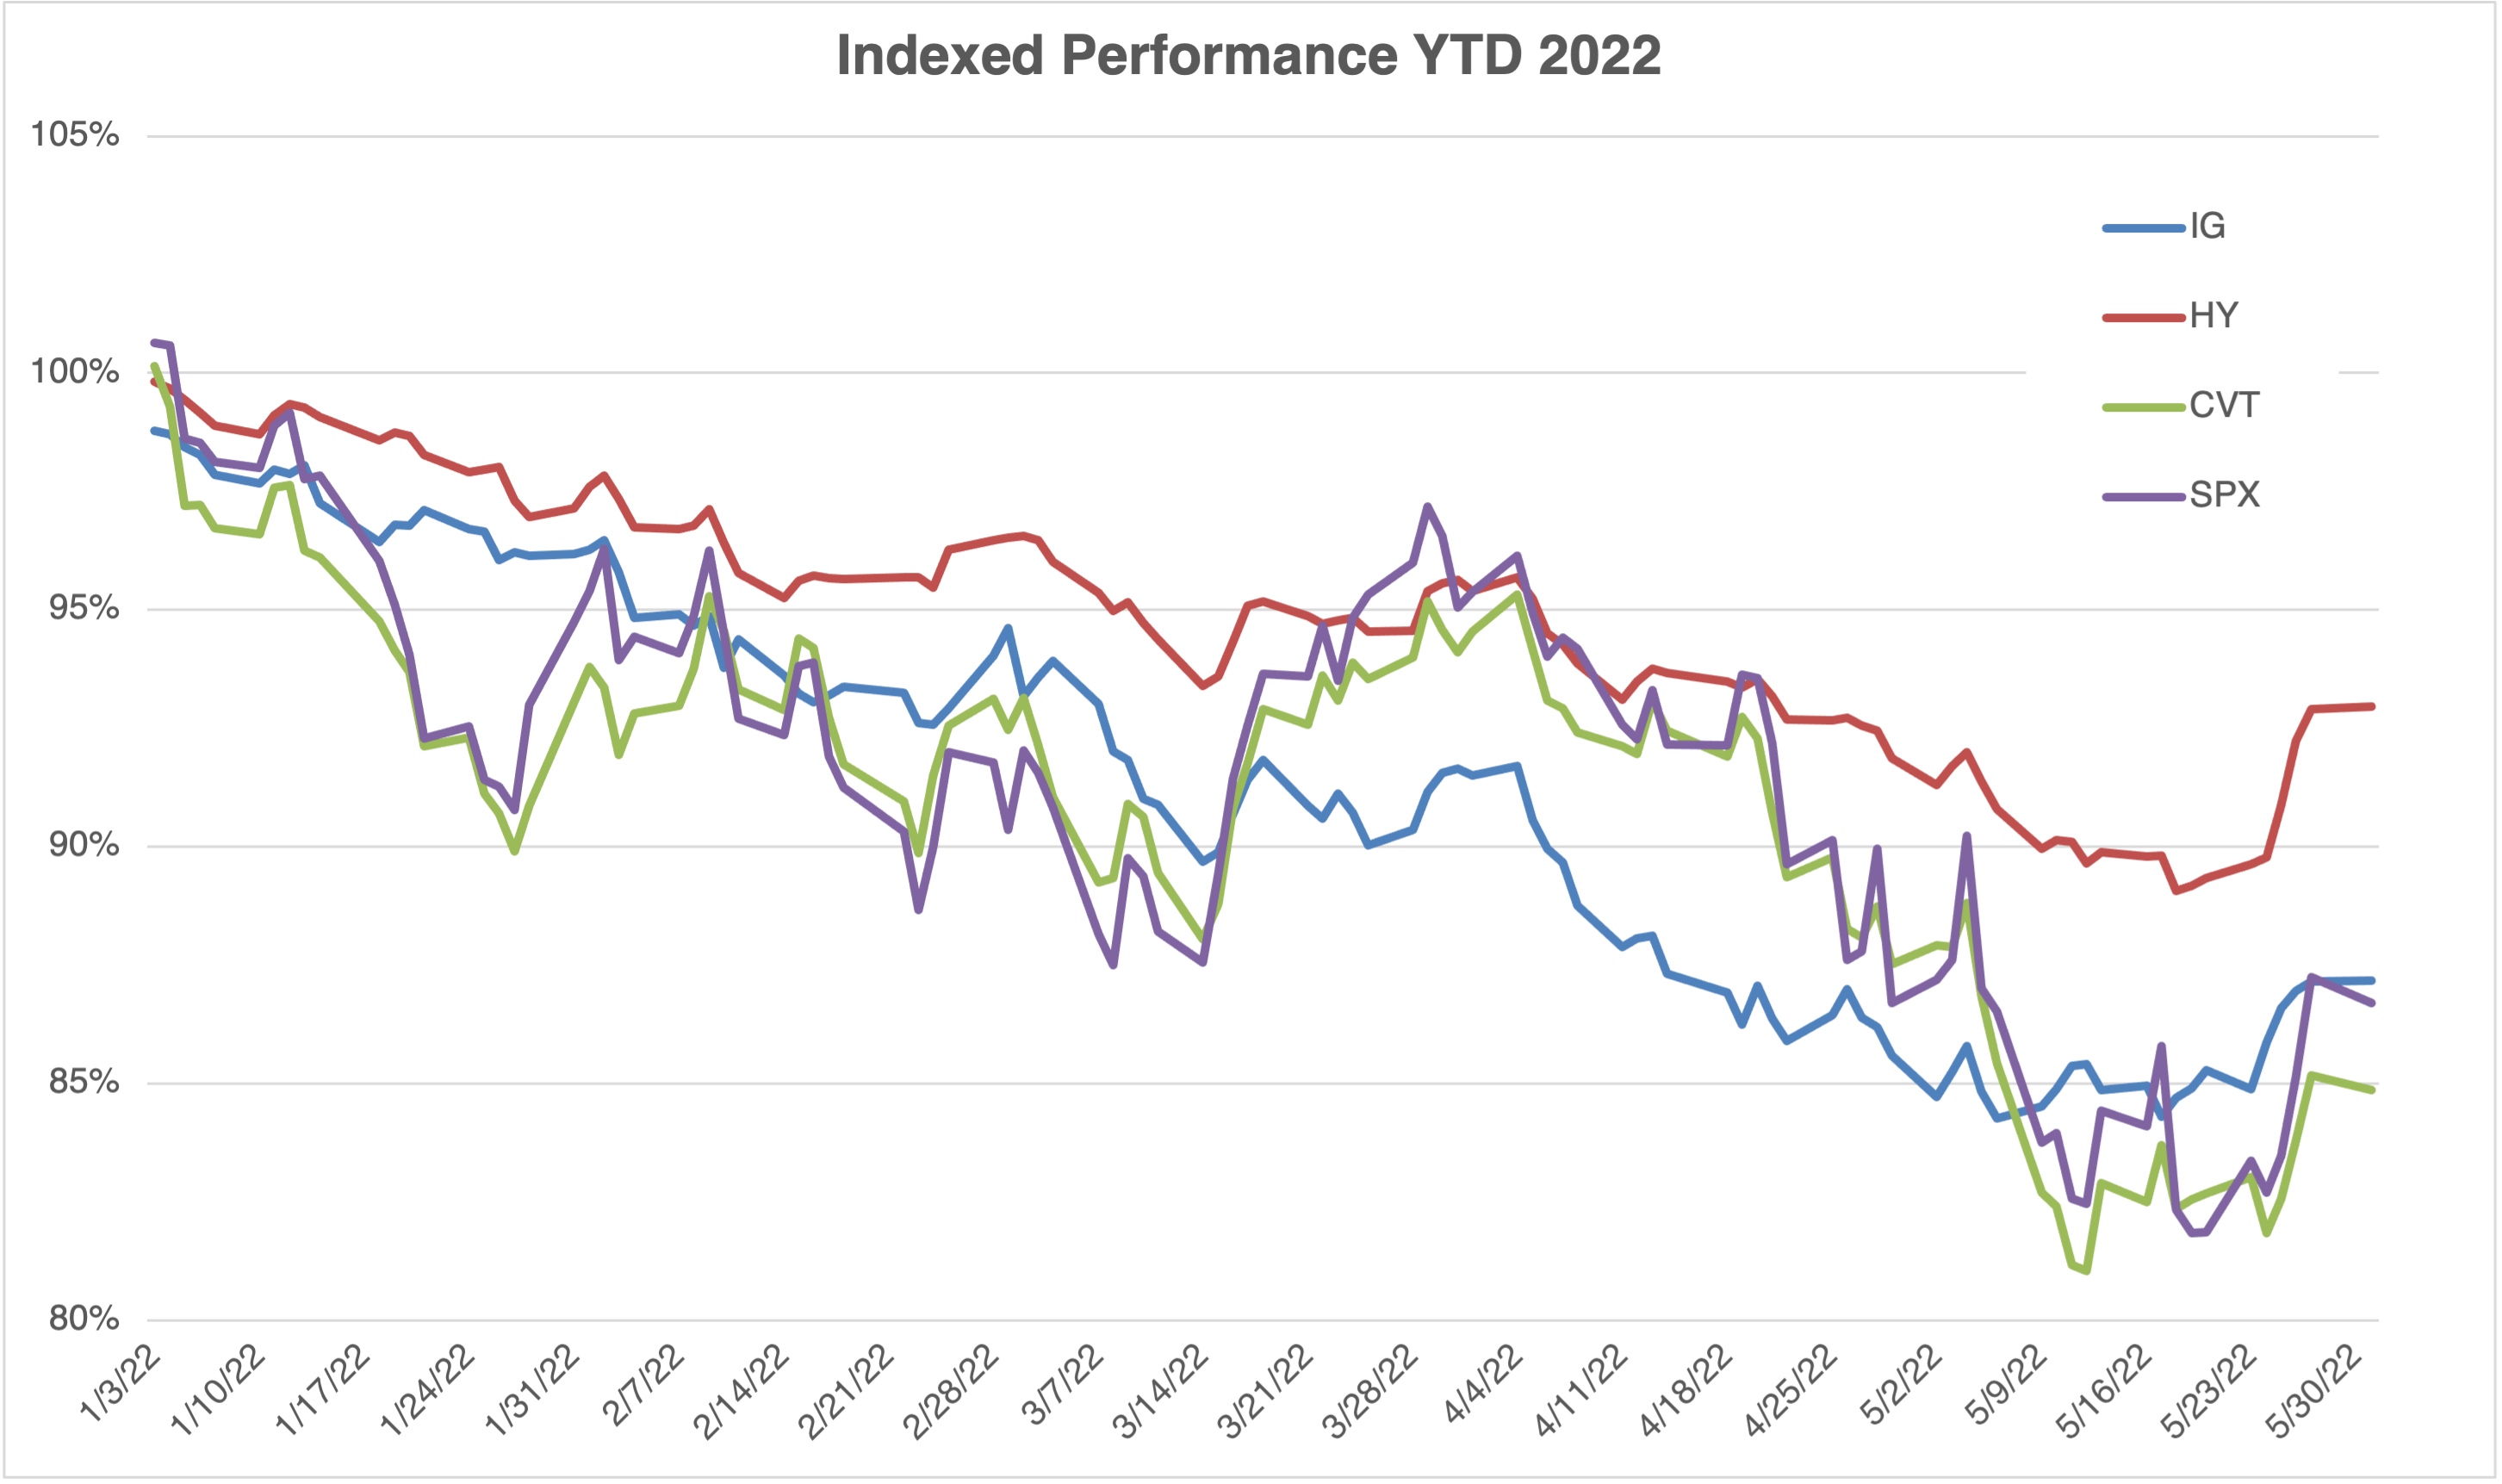
All markets are down, but the equity losses are greater than debt losses. This difference is to be expected given equity is a longer-duration asset and more junior in the capital structure than corporate debt. Like debt, equity valuations are affected by (1) the rise in interest rates (reduced present value of future cash flows, especially for high growth sectors like tech) and (2) increased market perception of recession risk and resulting earnings contractions. Debt products are less sensitive to these variables than equity because of their shorter duration, fixed cash flows, and seniority in the capital structure.
Within corporate debt, it is interesting to note that the HY market has seen less of a price decline than IG. Although this may be counterintuitive, the difference is mainly due to the average duration of the IG bond index (8.9 years vs 4.2 for HY), rendering the IG market more sensitive to rate moves (125 – 150 bps across the curve during 2022) and spread moves (varies depending on rating category). Netting out the impact of rates, we see the implied loss from credit spreads to be roughly equal between the HY and IG markets.
Analysis of Secondary Convertible Market
We focus next on the more technical trading dynamic in the convertible market. Beyond absolute price performance of traded securities, we look at the loss (or gain) that is not attributed to share price moves or rates (as share price moves and interest rates are factors that arbitrage / hedge fund investors, which represent a meaningful part of the market, typically hedge).
We examine the universe of convertible bonds with $250mm or more outstanding as of year-end 2021, that traded with some liquidity at year end. We then calculate the “raw move” as the actual increase / decrease in the convertible prices today vs. 31-Dec-2021. This is meant to reflect the gains / losses that unhedged (also known as long-only, outright or fundamental) investors would have experienced in the market YTD.
To compute the hedged move, we calculate where convertible bonds would hypothetically be trading today, based on (1) changes (mostly decreases) in stock prices YTD, and (2) increases in interest rates since then, but keeping volatility and credit spread constant. We then compare the trading prices today to those hypothetical prices as an approximation for the gains / losses that hedged investors would have experienced in the market YTD. Finally, we repeat this analysis for 2Q QTD, and the month of May. The results of this analysis are below.
| Raw (Unhedged) Move | Hedged Move | |
|---|---|---|
|
May 2022 |
(4.3%) |
(3.4%) |
|
2Q’22 QTD |
(11.8%) |
(3.9%) |
|
2022 YTD |
(21.6%) |
(3.5%) |
Even though the raw (or unhedged) move is down significantly (i.e., ~22%), much of that is attributable to macro moves in equity and rates. Netting out these variables, the convertible market has cheapened by about 3.5 points this year.
While much smaller in absolute magnitude, these are large losses on a risk-adjusted basis. Hedged investors’ performance is an exercise in small percentage points due to the market neutral nature of their strategy. For example, the convertible market richened by 1.2pts in 2021, 1.4pts in 2020, 2.3pts in 2019 and cheapened by 2.0pts in 2018, so a loss of 3.5 pts YTD represents significant losses on a relative basis. Many funds have cut leverage over the last few years so even at 2 to 1 leverage, the data is consistent with many funds being down 3 to 6% all-in (Source: Bloomberg FPC screen).
Additionally, the majority of the loss for arbitrage investors occurred during May (3.4% of 3.5% YTD). This highlights that the convertible market is trading weaker than it was even a few months ago (independent of other market factors), and investor sentiment is likely at a local low.
Primary Issuance Analysis
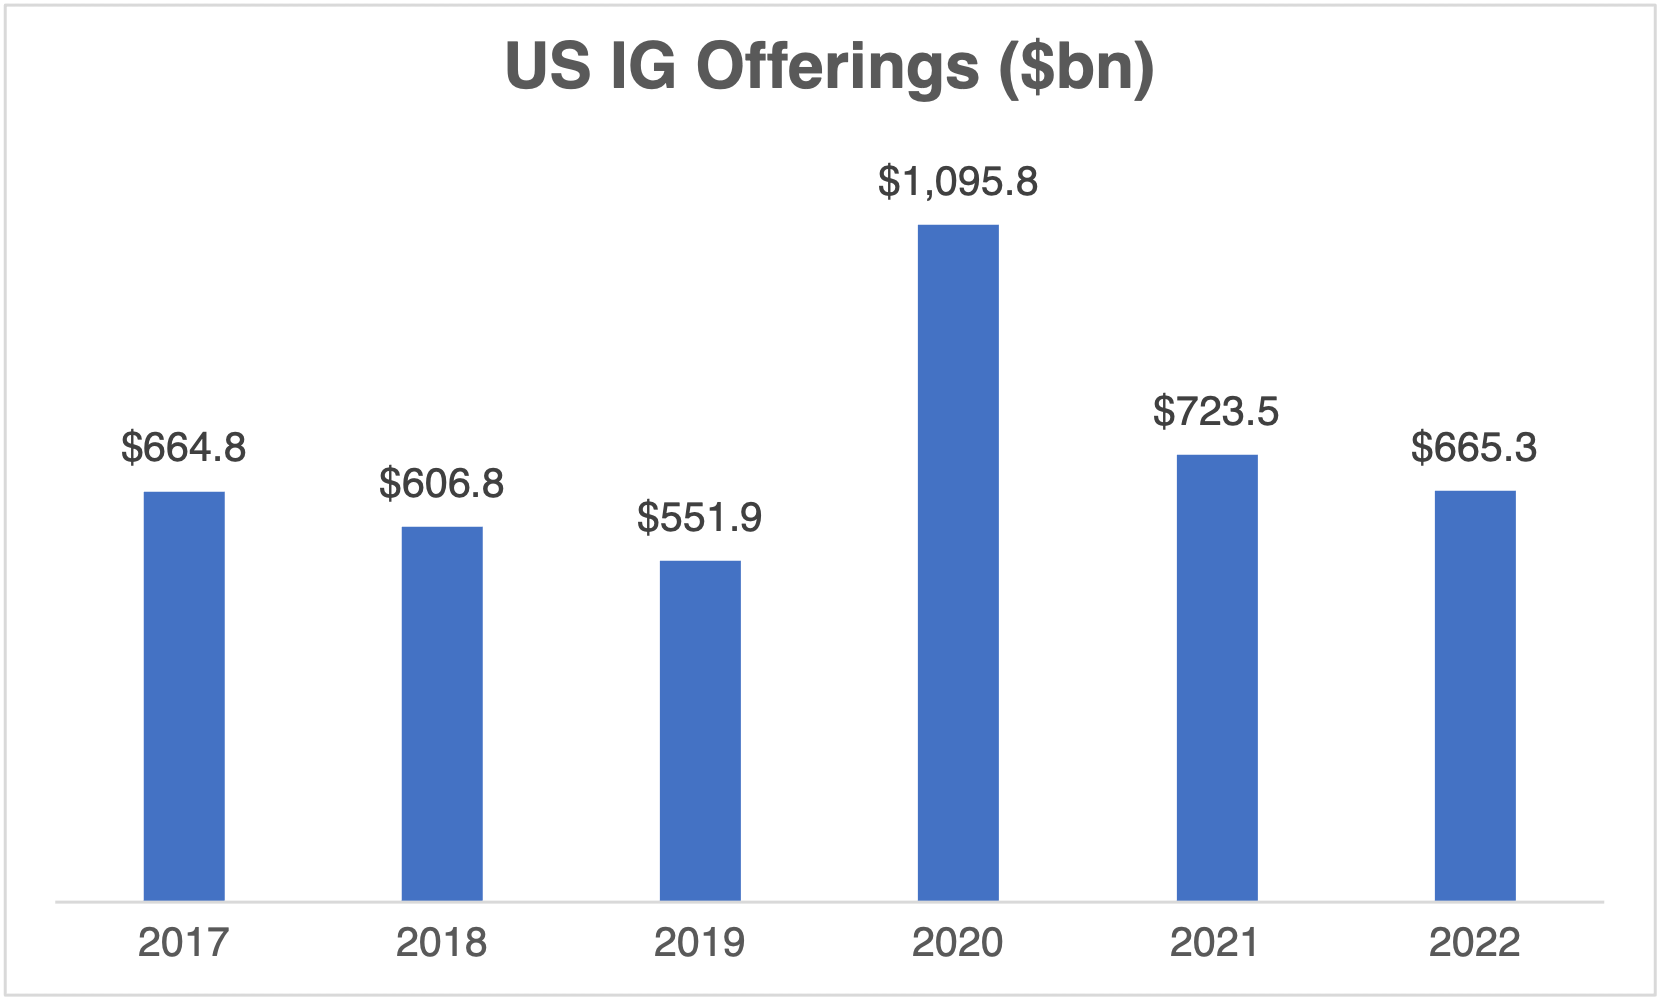
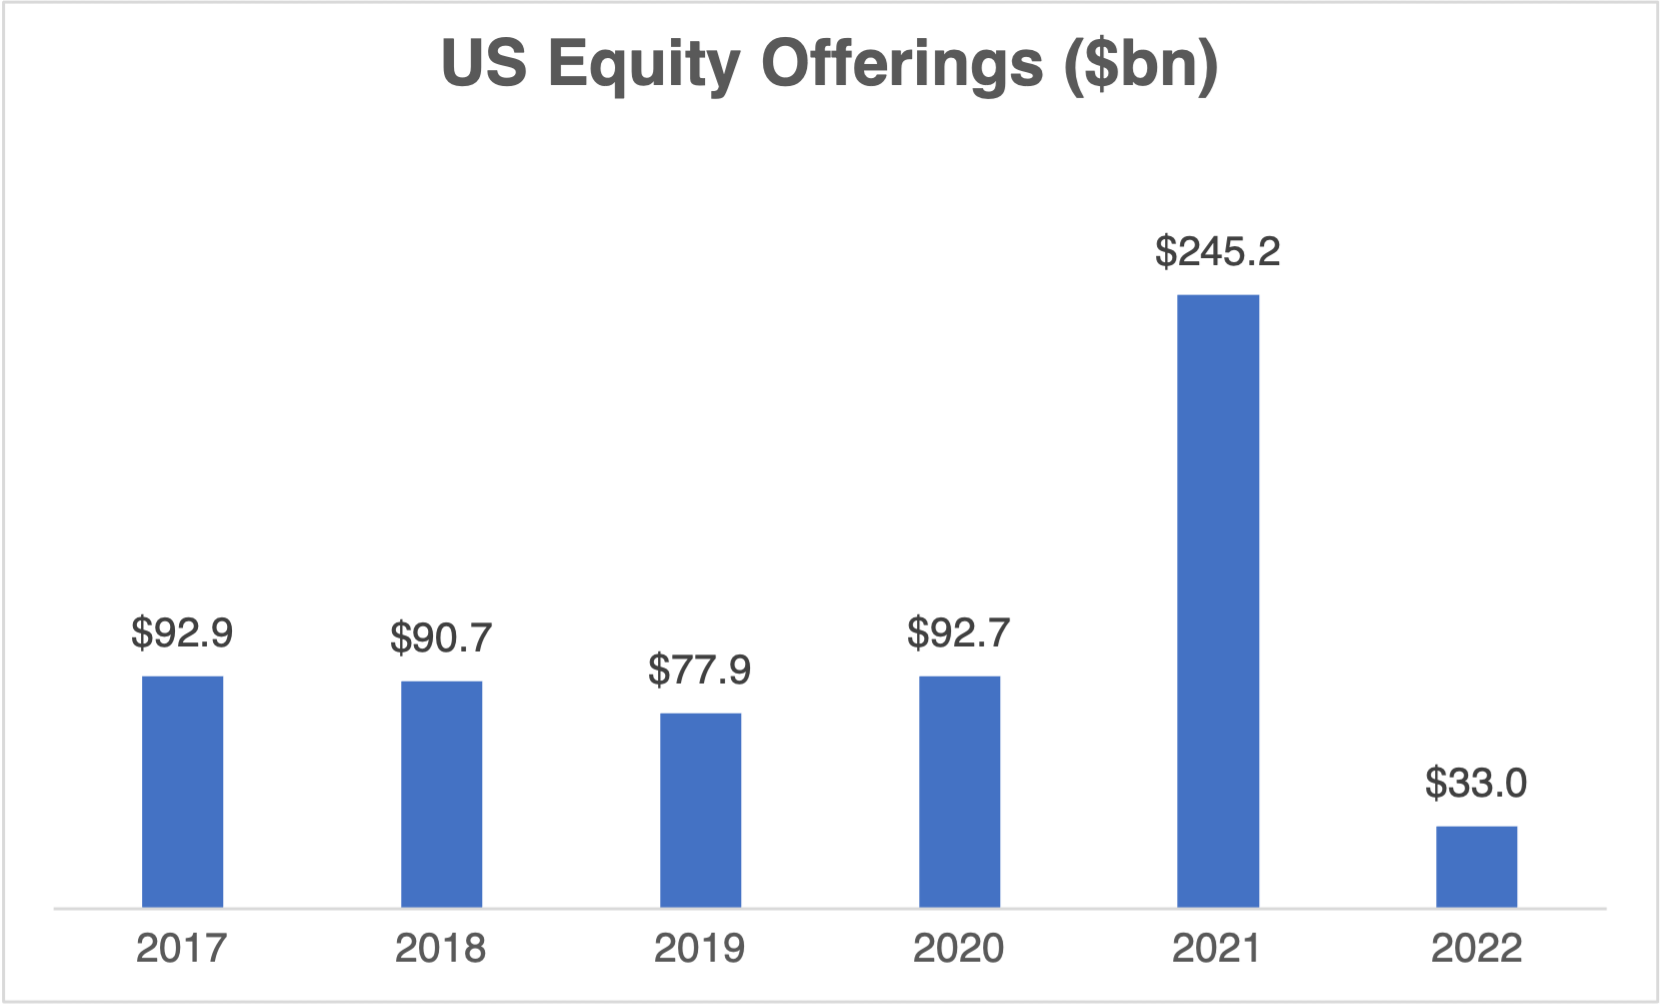
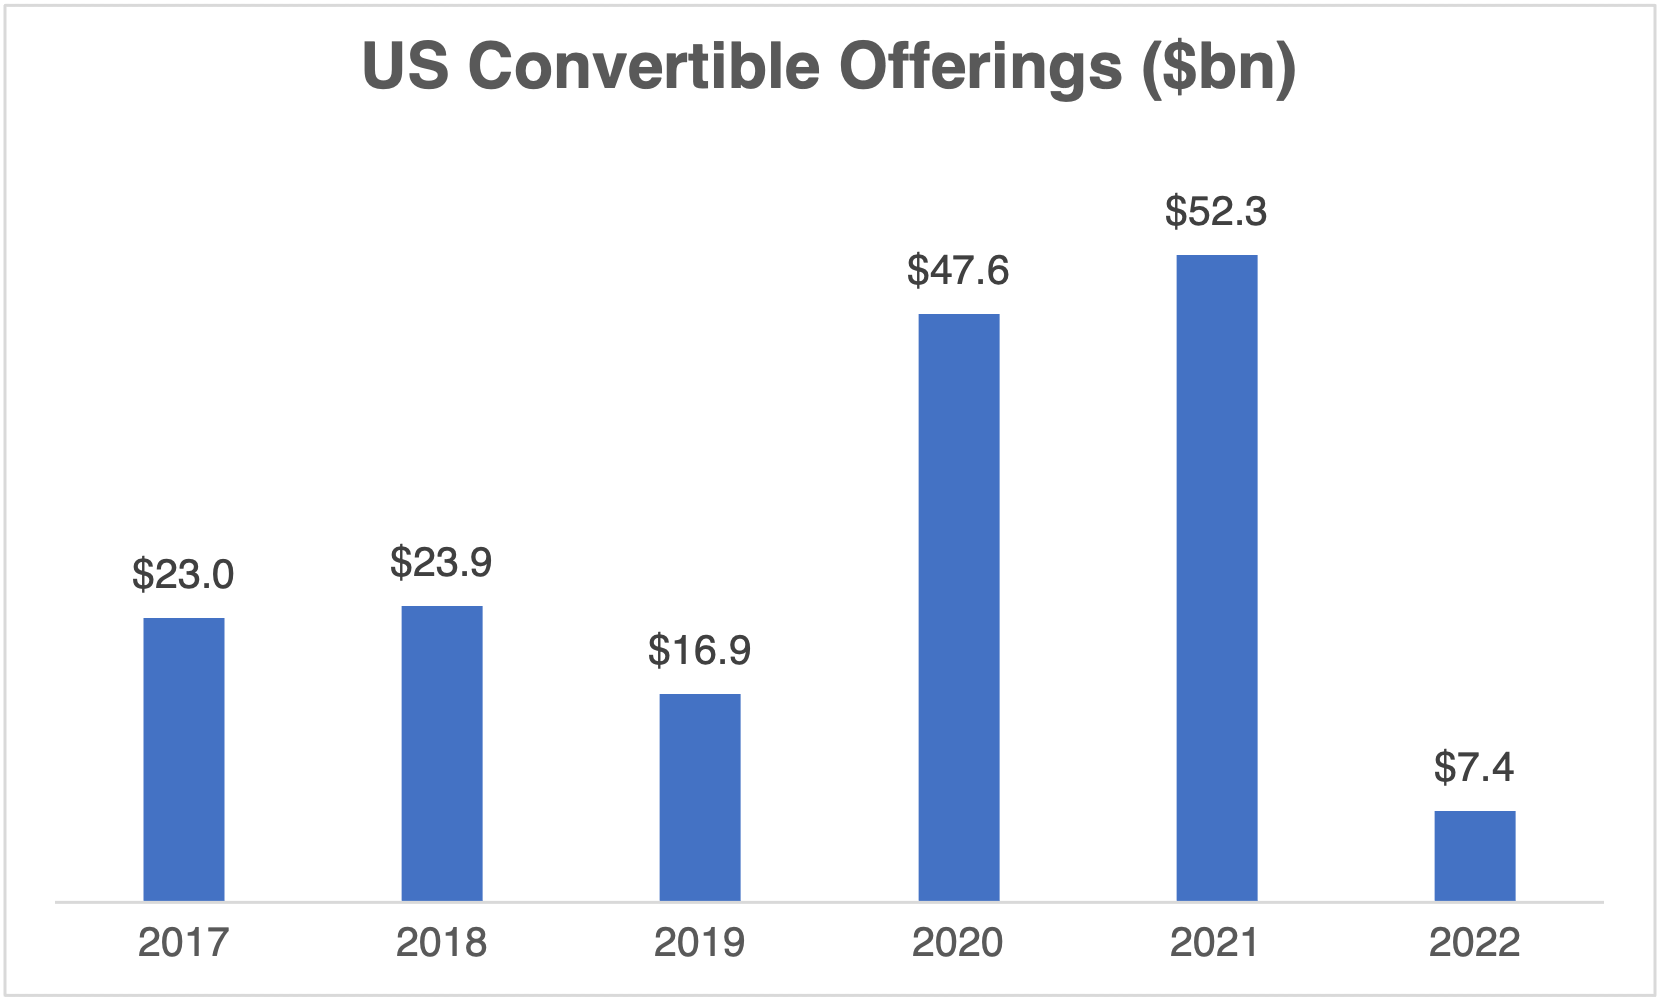
Given the relative instability in each of the asset classes, it is unsurprising that primary issuance volumes are generally down in 2022. While 2020 and 2021 were a bit of an anomaly (due first to financings driven by COVID then followed by Federal Reserve liquidity injections), we also look at volumes in 2017, 2018 and 2019 to contextualize “normal” issuance in each market. See below for 2022 YTD issuance volumes when compared to the same time periods in 2017 through 2021.
Source: Bloomberg league tables. Shows Jan-1 to May-31 issuance in each of 2017 to 2022.
Volumes in the Investment Grade market are in line with other years, other than 2020. This is the only market where issuance volumes are not down significantly, even though the IG index is down 13% YTD. This may be driven by the fact that the IG market is down primarily due to rates, rather than a re-rating of credit / default risk in the asset class; and because a higher fraction of the capital in the space represents institutions that need to remain invested (e.g., insurance portfolios).
By contrast, the HY, equity and convert market volumes are anemic. Many issuers came to market in 2020 and 2021 on an opportunistic basis, and now that the markets are under pressure there is a relative hesitancy to issue at current levels. The view from most issuers is that unless capital is necessary (i.e., defensive or for a tangible use of proceeds), there is no need to go today until sentiment / pricing is better.
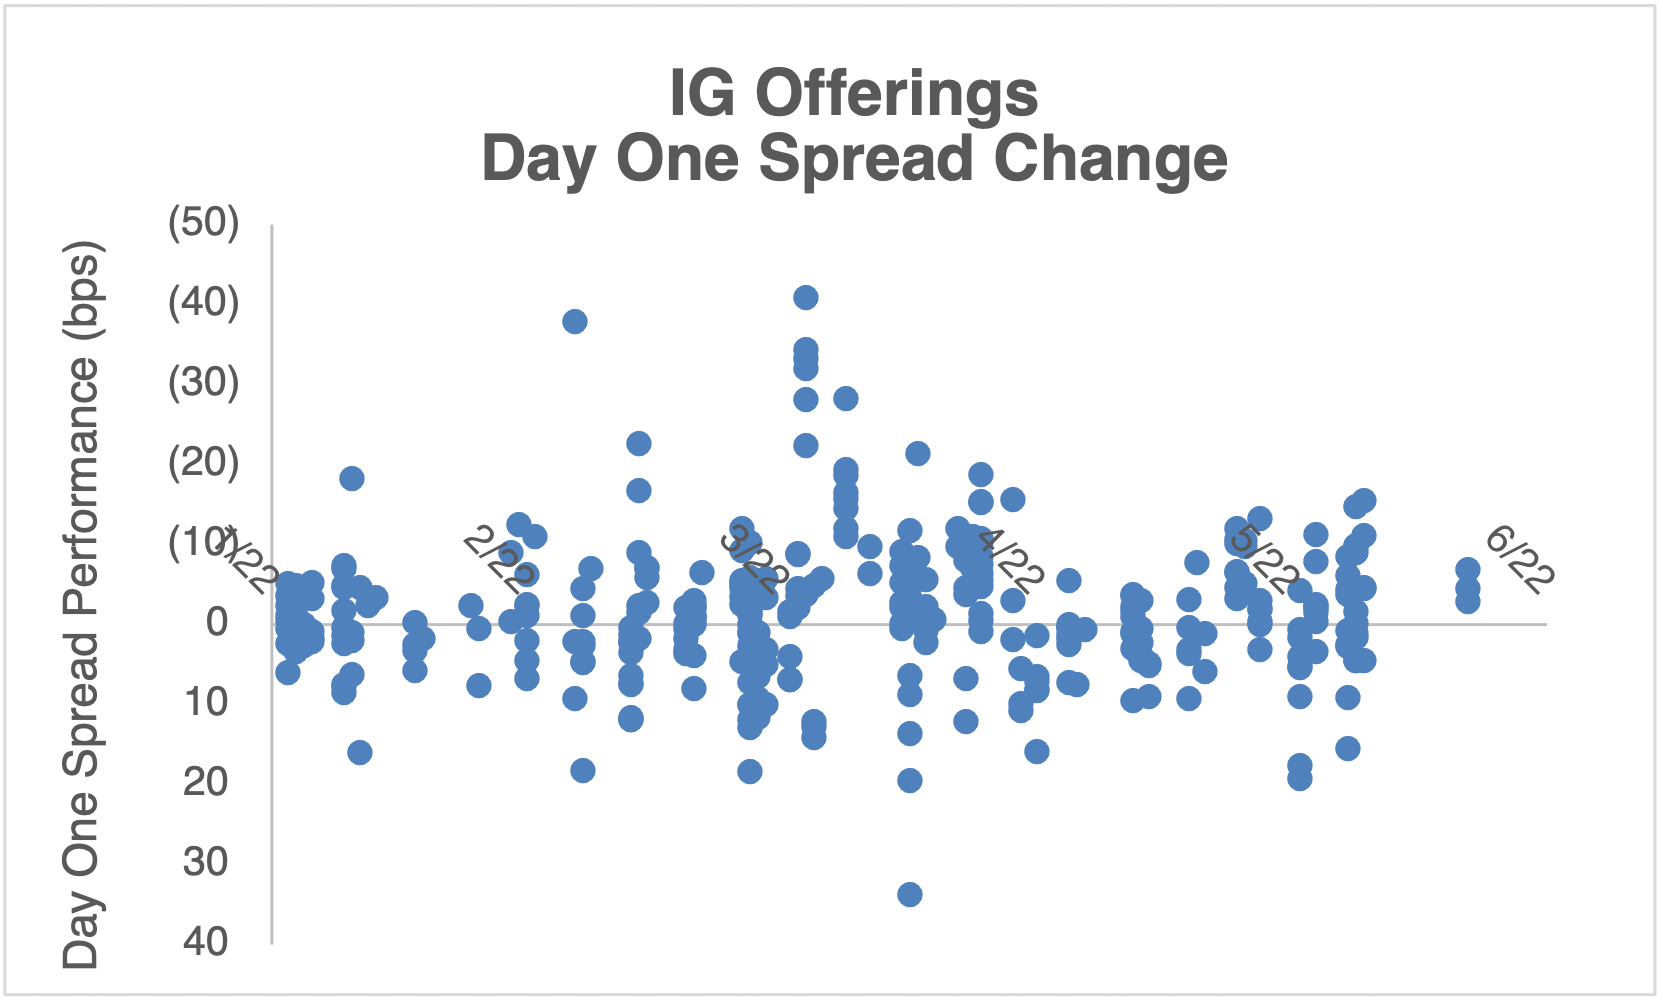
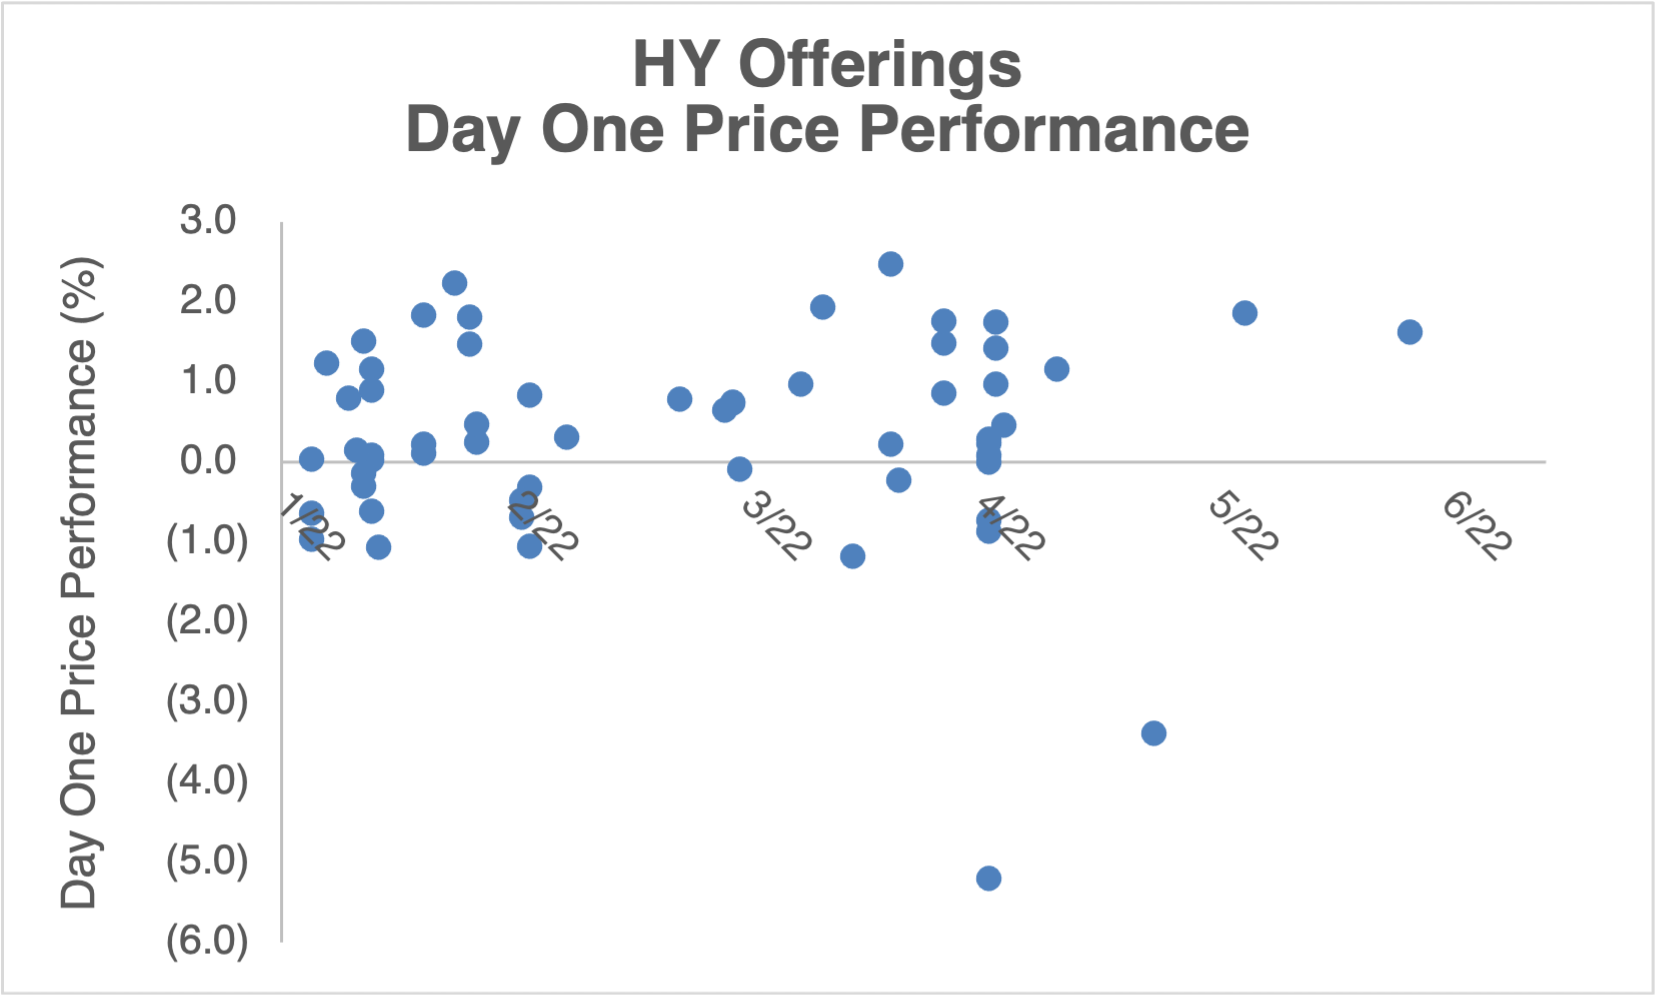
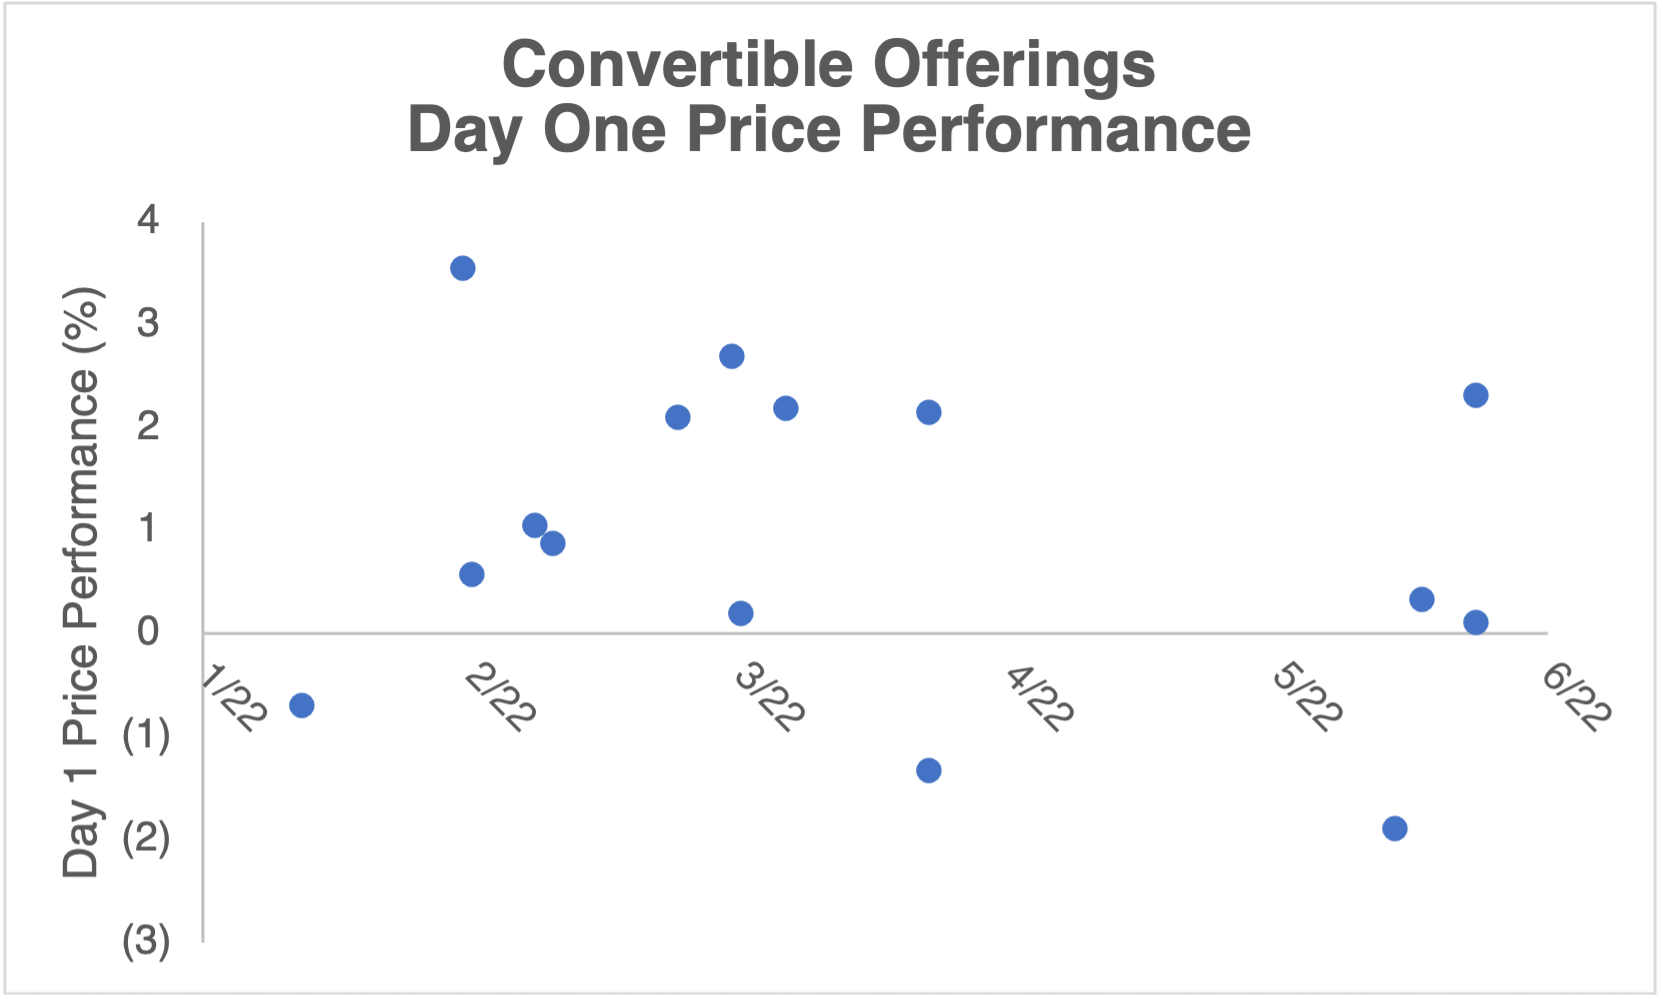
New Issue Trading Dynamics
Another factor that plays into new issuance (and volumes) is how deals perform immediately after issuance. Being able to make money on new issues allows investors to be more aggressive on allocations and terms for further new deals. The charts below look at how recent deals have performed in each market from issue to the first close date reported by Bloomberg (typically T+1 but can be longer for bond deals). Note, for the convertible market, we look at the “delta-adjusted” price to account for any move attributable to share price.
Source: Bloomberg and Matthews South internal database
Summary Statistics
| Average | Median | |
|---|---|---|
|
Investment Grade (Spread) |
-0.1 bps (tighter) |
+0.4 bps (wider) |
|
High Yield |
0.3 pts |
0.3 pts |
|
Convertible |
1.0 pts |
1.0 pts |
|
Equity |
6.5 pts |
2.8 pts |
Although some deals traded down, the vast majority of deals have traded up. For example, in the convertible market, only 3 out of 15 deals traded down and the average deal traded up ~1pt — We typically advise issuers to target a deal trading up ~1pt. The HY and equity markets also have similar fact patterns where the majority of deals are trading up with normal new issue concessions. Against a backdrop of dislocated market levels, the day-1 performance in the primary market has continued to function at a normalized level.
The IG market results are more varied, which can be an indication of the strength of the market itself. Since issuers are not compelled to make sure deals “work”, they can continue to price deals at a risk of trading down slightly. The average deal is essentially trading in-line with the original pricing, which means new issue concessions are low. Issuers continue to have leverage in deals to price reasonably well in the context of current credit spreads. It is important to note that spreads have generally widened, so it can be a trade-off between pricing deals at wider spreads, but with low new-issue concessions.
The fact that new issue deals are still working should continue to bode well for each market as investors will be more inclined to participate in new deals.
New Issue Convertible Valuation
Despite deals in the convertible market trading up modestly (and in line with historical precedents), we can separately analyze the theoretical price of each bond to see how efficient the market actually is. Convertible modeling is mainly based on two issuer-specific inputs (credit and volatility), which allows us to then calculate a fair-value of every security prior to issuance. Bonds are typically issued to the market at par, and thus we generally expect the theoretical price for any new bond to be slightly above (i.e., par plus a new issue concession).
Matthews South tracks theoretical prices for every deal using a fair-market assumption for credit and volatility. Historically, we have seen new issues come to market with a ~102% theoretical price (102.1% in 2021), while 2022 deals have averaged 103.6%. In stronger markets, issuers have leverage to push terms tighter and do not require significant new-issue concessions and transactions price closer to 100% value; however, when markets are weaker (and more investor friendly), new issue valuations need to be higher to entice investors to participate in deals. Bonds with higher theoretical values result in increased coupons, or lower conversion premiums, which are less attractive for issuers.
This “cheapness” coupled with a change in rates and credit spreads has resulted in terms that are much less issuer friendly than at the start of the year. The table below compares theoretical terms for a B-rated issuer at the start of the year vs. today.
| 31-Dec-2021 | Today | Net Change | |
|---|---|---|---|
|
B Credit Spread (bps) |
3.51% |
4.71% |
+1.20% |
|
Interest Rate |
1.38% |
3.06% |
+1.68% |
|
Straight Debt Coupon |
4.89% |
7.77% |
+2.88% |
|
Convertible Coupon |
0.60% |
2.93% |
+2.33% |
Where is the money going?
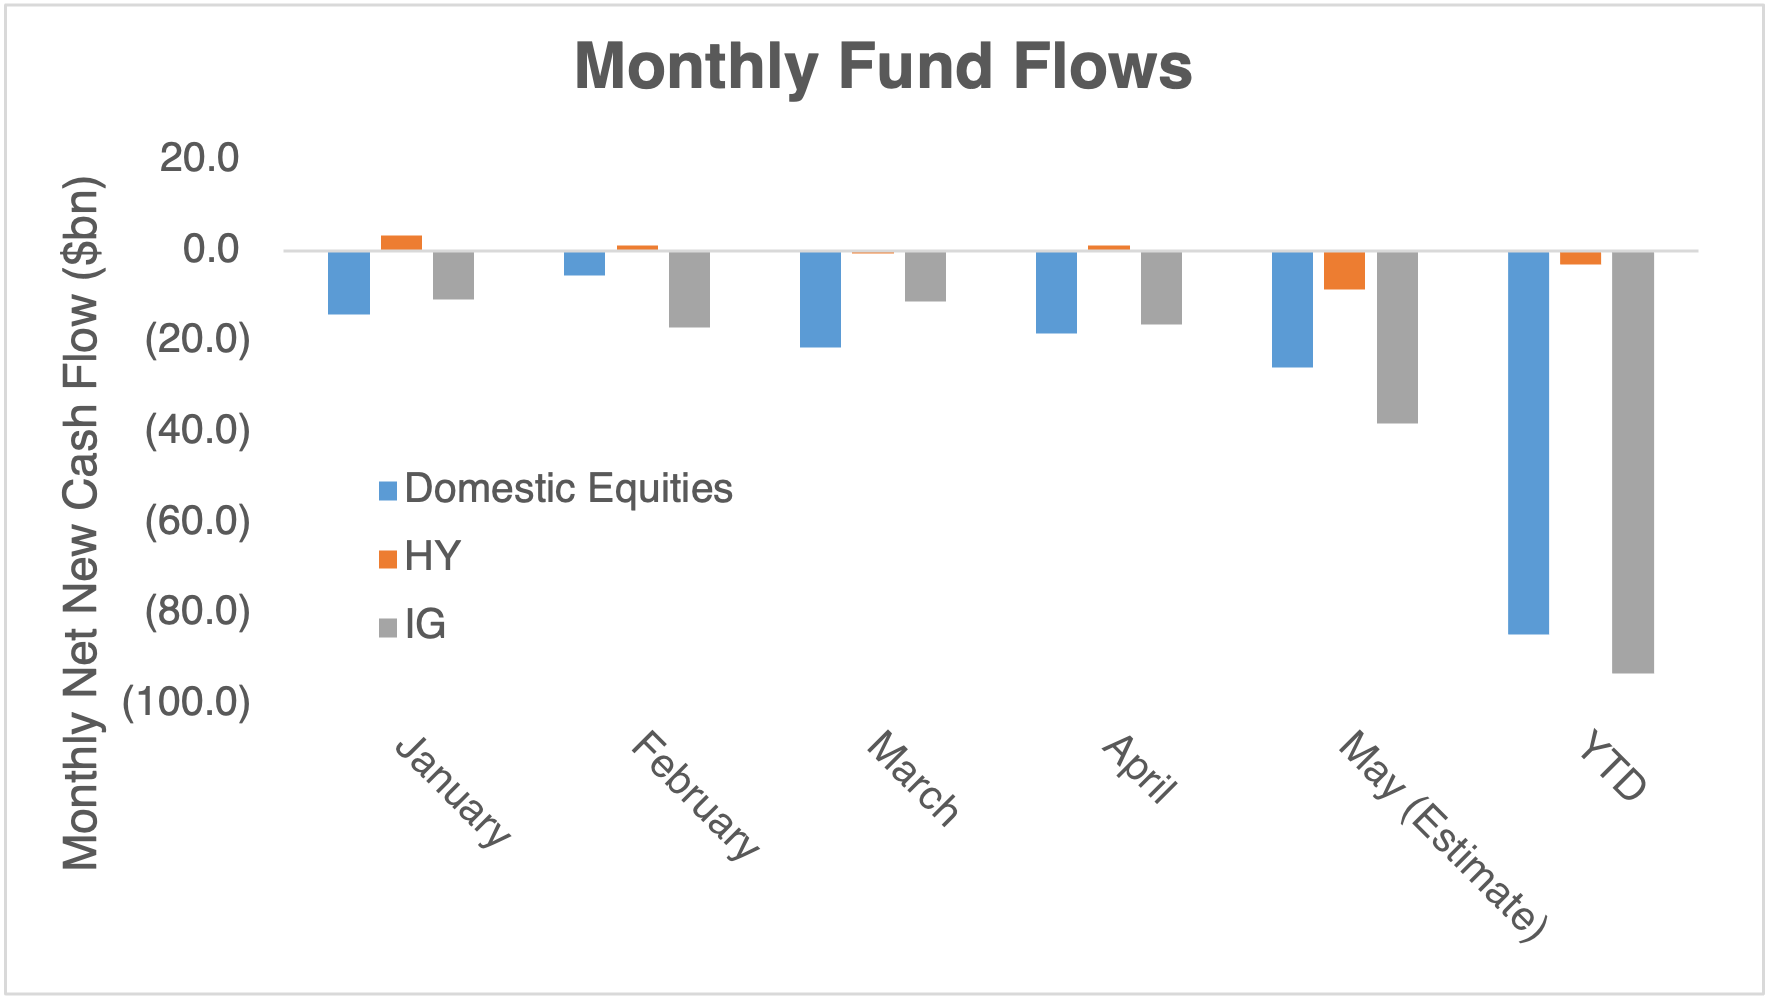
Finally, we review broadly the funds flow across asset classes by professional investment managers to contextualize US capital market dynamics. By analyzing the flow we can further understand investor sentiment and willingness to put capital to work in those products.
For long-term mutual funds flows in 2022 we have seen an outflow of ~$85bn in domestic equities, outflow of $93bn in IG, and an outflow of $3bn in HY.1 Again, not terribly surprising to see the largest outflows from IG and equities given the relative performances YTD, but it is interesting nonetheless to see a very modest outflow from HY. The larger move from IG compared to HY is likely due to investors trying to protect themselves from rate moves, while the move out of equities is likely due to a general de-risking.
Conclusion
Issuers looking to raise capital should continue to monitor the markets because the new issue market is open. However, the overall market sentiment can change quickly. So issuers should prepare in advance, be flexible in both timing and structure, and stay up to date on pricing dynamics across markets to best decide how and when to implement their financing plans.
Markets are constantly evolving, so please reach out to the Matthews South team to see what terms may look like under the current market conditions.
1 Including ETF flows, there have been net flows into equities, but this suggests more of a focus on short-term trading rather than long-term investment allocations.
Personal Views: The views expressed in this report reflect our personal views. This blog post is based on current public information that we consider reliable, but we do not represent it is accurate or complete, and it should not be relied on as such. The information, opinions, estimates and forecasts contained herein are as of the date hereof and are subject to change without prior notification. The large majority of reports by us are published at irregular intervals as appropriate in our judgment and ability to produce, so updates may not be made or available even when circumstances may have changed.
No Offer: This analysis is not an offer to sell or the solicitation of an offer to buy any security in any jurisdiction where such an offer or solicitation would be illegal. It does not constitute a personal recommendation or take into account the particular investment objectives, financial situations, or needs of individual clients. You must make an independent decision regarding investments or strategies mentioned on this website. Before acting on information on this website, you should consider whether it is suitable for your particular circumstances. You should not construe any of the material contained herein as business, financial, investment, hedging, trading, legal, regulatory, tax, or accounting advice. The price and value of investments referred to in this analysis and the income from them may fluctuate. Past performance is not a guide to future performance, future returns are not guaranteed, and a loss of original capital may occur.