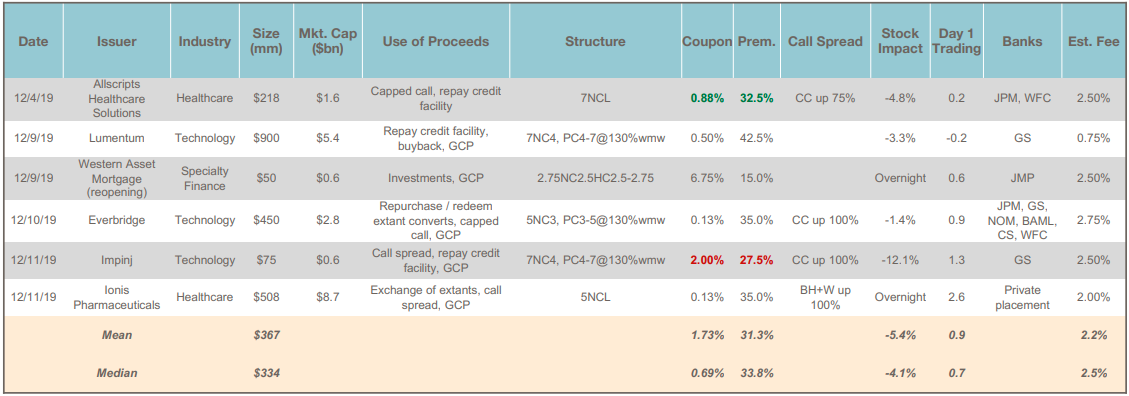
- Total Issuance: December saw 6 convertible debt deals for a total of $2.2 billion. This brings the 2019 total to $41.5 billion of convertible debt issuance over 101 deals. By comparison, 2018 saw $41.0 billion of issuance over 103 deals (2017: $28.2 billion / 80 deals). The market remained relatively technology-sector focused, with 64% of 2019’s volume coming from tech companies (51% by deal count); this was a very similar profile to 2018 (62% by volume / 51% by deal count).
- Day 1 Trading: Day 1 bond trading is an important metric of efficiency of execution. 2019 saw the average bond trade up 1.3 points on a stock-price adjusted basis, compared to +0.9 / +1.4 points in 2018 / 2017.
- Fees / Syndicate: Fees have remained relatively consistent over the last few years – 2.46% average fees in 2019 vs. 2.36% in 2018.
- Call Spreads: Call spreads continue to play an important role in the market, with 55% of deals in 2019 including one (48% in 2018). Last year’s innovation was the proliferation of upper strike prices in excess of 100% (10 deals vs 2 in 2018), which brought the average strike price to 100% from 93%.
