
We have previously discussed the economic rationale for repurchasing convertible bonds in times of market turbulence. Today we look at actual data regarding recent liability management transactions, and find:
- Over the past year, issuers have addressed upcoming convertible maturities on average 2.35 years before maturity. This is an additional cushion beyond the conventional wisdom that many issuers refinance or repurchase bonds 1 to 2 years before maturity to avoid them becoming “current liabilities.”
- Convertible liability management is often conducted with concurrent convertible financing or an exchange, which tends to come at higher repurchase prices, larger sizes and closer to maturity than standalone buybacks. However, 2023 (especially Q1) has seen an increase in standalone repurchases for cash and/or shares.
- Consistent with basic bond math, repurchases earlier in the life of convertible debt tend to occur at deeper discounts to par than buybacks closer to maturity.
Our software tracks the amounts outstanding and trading prices of more than 450 convertible bonds in the U.S. market. From this data set and a review of company filings, we identified the subset of convertibles where issuers have repurchased or exchanged that bond for the first time within the last year.
Summary Statistics
Below are the key statistics from our data set:
| Period | # Deals | Average Years to Maturity | Average Size Reduction | Median Repurchase Price |
Deals Financed with New Converts |
|---|---|---|---|---|---|
|
Q3 2022 |
15 |
2.30 |
59% |
99.0 |
9 (60%) |
|
Q4 2022 |
11 |
2.14 |
53% |
91.3 |
7 (64%) |
|
Q1 2023 |
20 |
2.55 |
41% |
91.9 |
8 (40%) |
|
Q2 2023 |
16 |
2.27 |
55% |
105.6 |
9 (56%) |
2021 saw a shift towards Net Share Settlement as companies either early adopted ASU 2020-06 or anticipated its adoption. In 2022 and 2023, this continued a bit further with 27% and 3In the last 4 quarters, liability management transactions occurred an average of 2.35 years before maturity. Deals ranged from optimization transactions in the final few months (Hope Bancorp bought a few bonds at a small discount ~2 months before maturity, and WWE exchanged 80% of its deep in-the-money bonds ~7 months before maturity); to companies that refinance a year or two after issuance because conditions have changed (Cytokinetics refinanced an in-the-money bond with 4.5 years to go). But the overall trend is not to wait until the last minute: only 16% of these transactions occurred in the final year, and in the final 18 months the number was still just 29%.
Timing was particularly early in Q1 2023. There were a higher-than-usual number of opportunistic standalone buybacks occurring very early at deep discounts to par. These were often from sectors that had particularly frothy valuations in 2021 that reversed in the last 2 years, including Affirm (3.8 years at a price of 69), Arrival (3.8 years @ 59), OpenDoor (3.4 years @ 54) and Coinbase (3.0 years @ 71).
Buyback size varied considerably: from 4% for small opportunistic buybacks to 100% for redemptions and tender offers. The average is around half of the outstanding bonds. This makes sense given the constraints that issuers have on approaching investors outside of public tender offers: many issuers are advised by counsel, for example, not to transact with more than 10 investors or buy more than 80% of outstanding bonds.
Statistics by Type of Financing
Additional economic relationships emerge when we filter deals by the type of financing.
| Financed with New Convert | Average Years to Maturity | Median Repurchase Price | Average Size Reduction |
|---|---|---|---|
|
Yes |
2.26 |
101.0 |
60% |
|
No |
2.44 |
90.3 |
40% |
- Intuitively, buybacks financed with a new convertible issuance are larger than standalone buybacks. This may be explained by several factors:
- First, standalone buybacks are limited by issuers’ excess cash on hand; a concurrent refinancing eases that constraint.
- Second, it may be easier to convince investors to participate in a refinancing transaction if they would like to maintain their exposure to the company.
- Third, it may be easier to identify investors with existing positions through the announcement of an intended refinancing than through wall-crossed repurchase processes that are limited in their outreach and rely on holders lists that may be out of date.
- Standalone buybacks tend to occur at lower prices than convertible-for-convertible refinancings. This is likely driven by issuer demand: if existing convertibles are trading at meaningful discounts to par, issuers’ stock prices are lower and credit spreads may be wider. Issuers may then prefer to use balance sheet cash over issuing new convertibles at undesirable terms.
- Consistent with the Q1 data above, standalone buybacks also happen a bit earlier than convert-for-convert refinancings. This may be a function of the fact that deeper discounts tend to occur when there is more time to maturity, or the fact that issuers may not want to incur the transaction costs of a new financing until more time has passed in the life cycle of existing bonds.
Price vs. Time
Finally, the chart below plots the prices of a convertible repurchase against the number of years remaining to maturity for that bond (the size of the plotted points represents the % of bonds retired). While price data is very noisy,1 repurchase prices are usually lower for transactions earlier in the life of bonds, and approach par as maturity approaches: repurchases happen at a price ~6 points higher for every year closer to maturity that they occur.
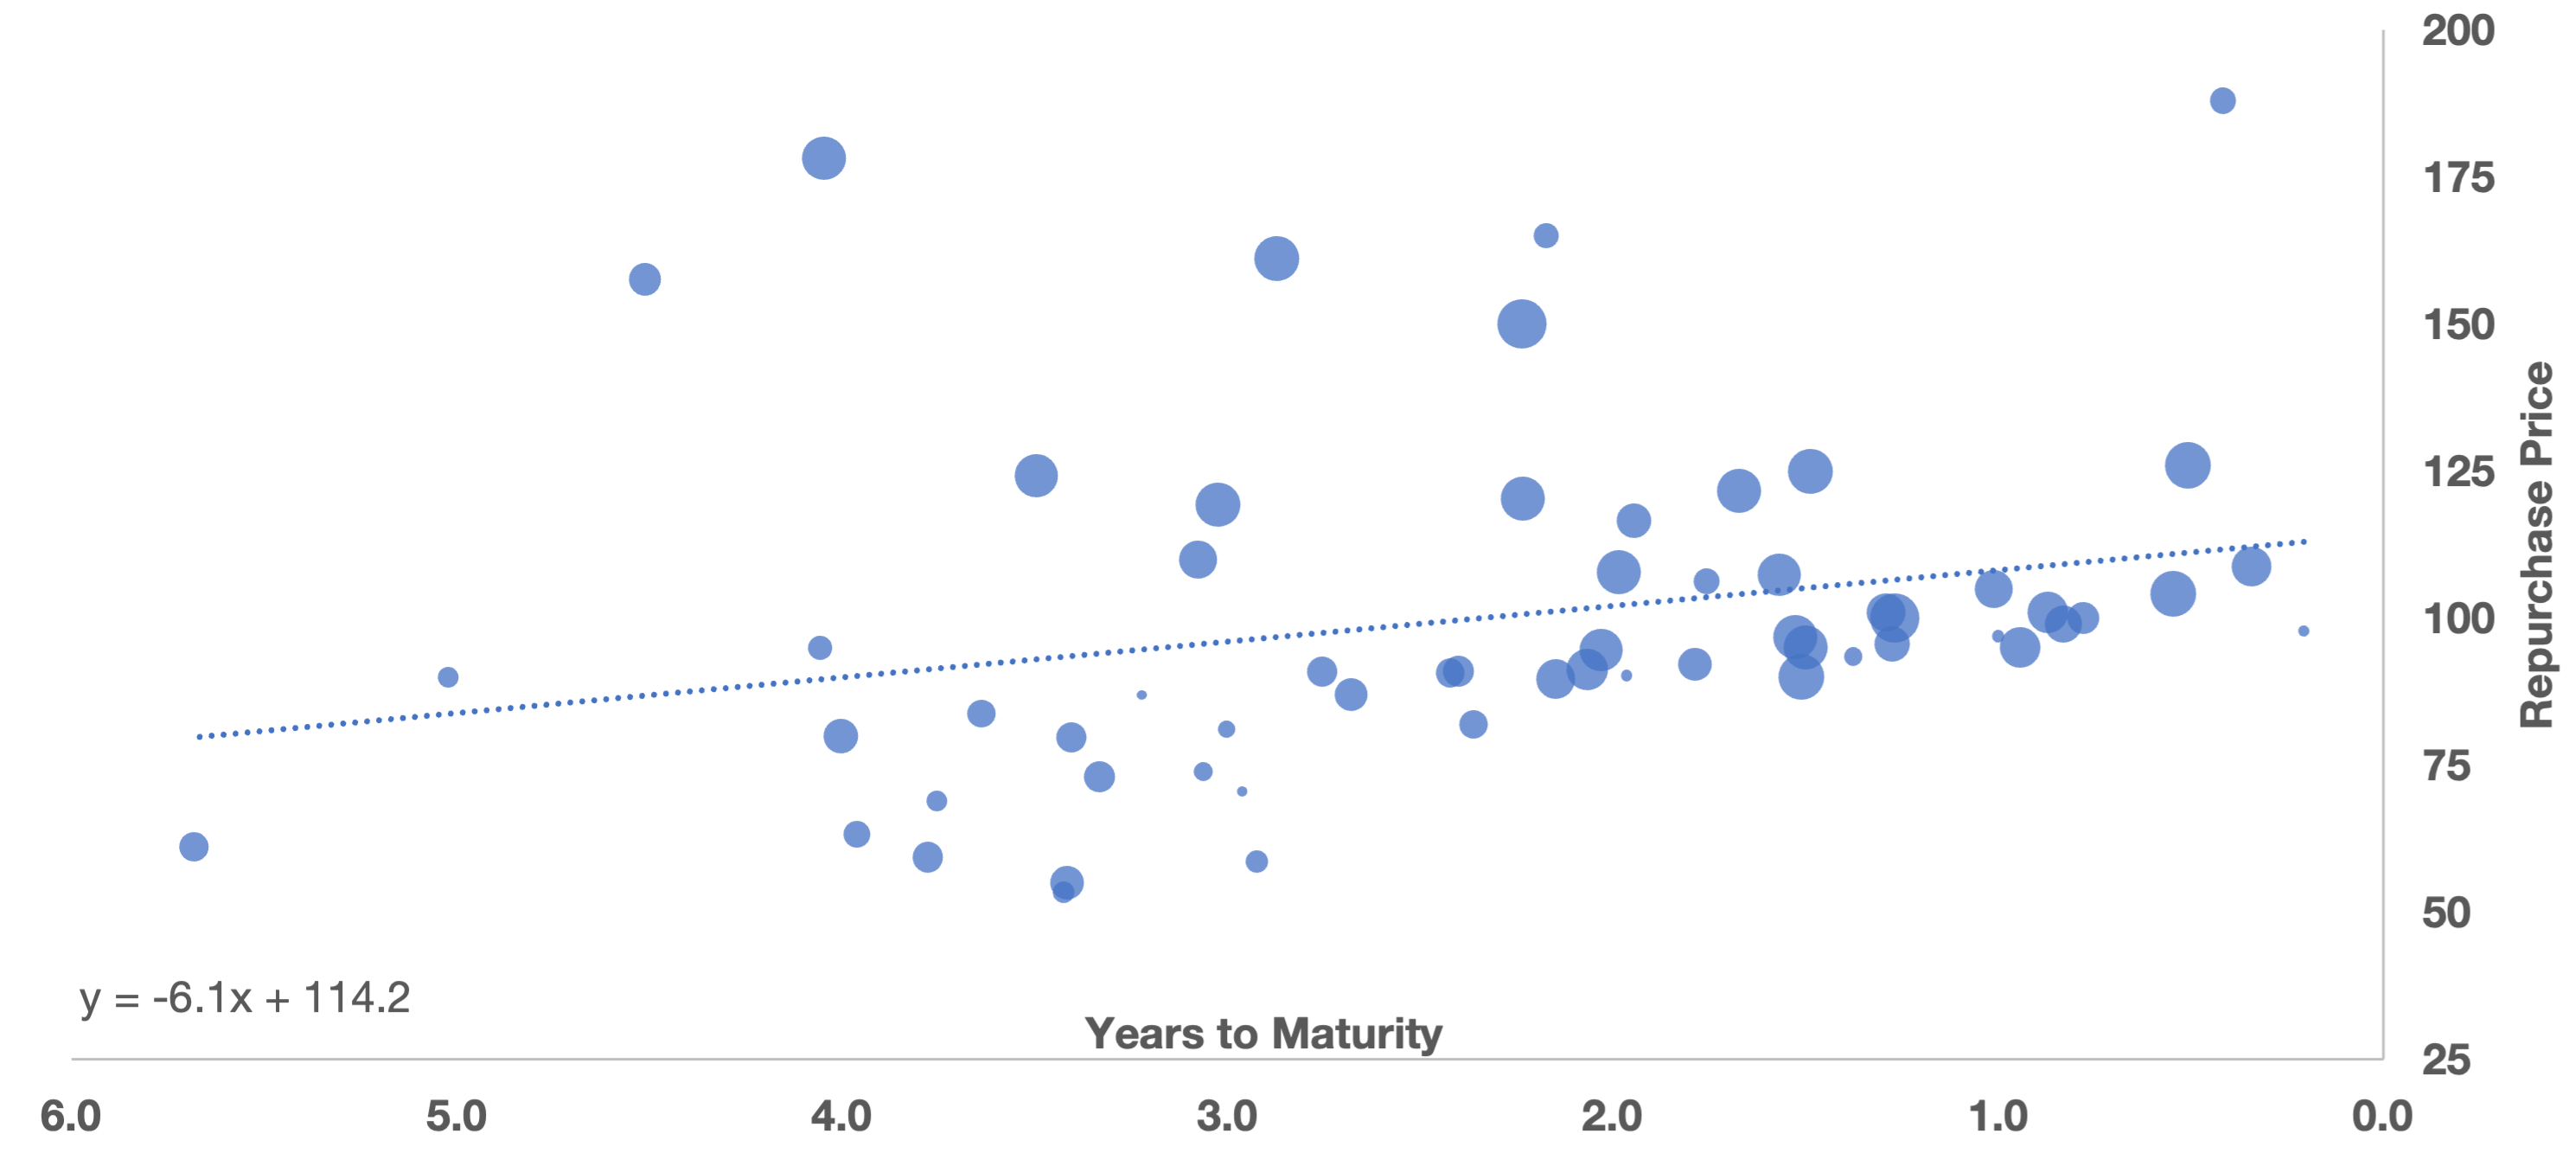
This is likely a simple consequence of bond math. If bonds are trading lower because of higher rates or credit spreads, that will result in a larger discount to par farther from maturity. With convertibles, the time value in the conversion option can work the other way around (an at-the-money or in-the-money bond will trade higher with more years to go); but liability management tends to be more attractive to issuers with lower prices, so we see the trend above.
Please reach out to Matthews South for any questions involving potential convertible liability management for your company’s securities or the convertible markets more generally.
1 Two outliers with repurchase prices ~400 are excluded from this analysis.
Personal Views: The views expressed in this report reflect our personal views. This blog post is based on current public information that we consider reliable, but we do not represent it is accurate or complete, and it should not be relied on as such. The information, opinions, estimates and forecasts contained herein are as of the date hereof and are subject to change without prior notification. The large majority of reports by us are published at irregular intervals as appropriate in our judgment and ability to produce, so updates may not be made or available even when circumstances may have changed.
No Offer: This analysis is not an offer to sell or the solicitation of an offer to buy any security in any jurisdiction where such an offer or solicitation would be illegal. It does not constitute a personal recommendation or take into account the particular investment objectives, financial situations, or needs of individual clients. You must make an independent decision regarding investments or strategies mentioned on this website. Before acting on information on this website, you should consider whether it is suitable for your particular circumstances. You should not construe any of the material contained herein as business, financial, investment, hedging, trading, legal, regulatory, tax, or accounting advice. The price and value of investments referred to in this analysis and the income from them may fluctuate. Past performance is not a guide to future performance, future returns are not guaranteed, and a loss of original capital may occur.